
World Bank's New Logistics Index Shifts From Survey to Big Data, Exposing Global Connectivity Gaps
The World Bank has fundamentally re-engineered its Logistics Performance Index, abandoning perception surveys in favor of real-time supply chain tracking data to measure global trade efficiency.


- Data-Driven Economists
- Argue that objective tracking data is the only reliable way to measure and compare global infrastructure performance.
- Qualitative Trade Analysts
- Emphasize that human surveys are necessary to capture the soft friction of corruption, regulatory hurdles, and business climate.
- Developing Economy Policymakers
- Focus on how the new metrics highlight structural disadvantages but worry that informal logistics networks are excluded from digital tracking.
Fast facts
- The World Bank has officially transitioned its Logistics Performance Index from a survey-based model to a big-data framework.
- The new LPI 2.0 tracks over 80 percent of global goods trade using data from maritime, aviation, and postal operators.
- Objective metrics like container dwell times replace the subjective opinions of logistics professionals.
- The data reveals that excessive import delays in developing nations are often driven by inefficient customs processes rather than physical infrastructure.
- While the new system eliminates perception bias, it struggles to measure informal logistics networks and cannot explain the root causes of delays.
Why this matters
By replacing subjective opinions with hard data, the new index allows governments to pinpoint exactly where supply chains are failing, enabling targeted infrastructure investments that lower the cost of everyday goods.
When a country's supply chain bottlenecks, consumers pay the price at the checkout counter and local businesses lose their competitive edge in global markets. For over a decade, governments and multinational corporations relied on a single metric to diagnose where these trade arteries were clogged: the World Bank's Logistics Performance Index. Yet, the tool dictating billions of dollars in infrastructure investment was historically based entirely on human opinion.[6]
That era of perception-based measurement has officially ended. The World Bank has finalized its transition to the Logistics Performance Indicators 2.0 (LPI 2.0), a fundamentally re-engineered framework that abandons surveys in favor of massive, real-time datasets. By ingesting shipment-level tracking data from maritime, aviation, and postal operators, the new index measures exactly how long a shipping container sits at a terminal, rather than asking a freight forwarder how slow the port feels.[1][4]
The sheer scale of the new data ingestion is unprecedented in trade economics. The LPI 2.0 framework captures over 80 percent of global goods trade by partnering with digital logistics platforms. It pulls Automatic Identification System (AIS) vessel-tracking data from MarineTraffic for maritime shipping, integrates aviation logistics metrics from Cargo iQ, and utilizes global postal performance data from the Universal Postal Union.[1][3]
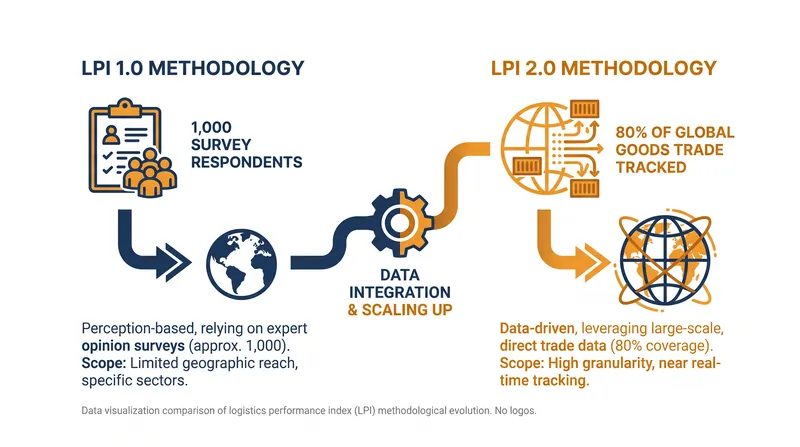
To understand the magnitude of this shift, one must look at how the original LPI operated. Introduced in 2007, the traditional index relied on a biennial global survey of approximately 1,000 logistics professionals. These respondents rated countries on a 1-to-5 scale across six dimensions, including customs efficiency, infrastructure quality, and timeliness.[2][6]
While the survey method successfully captured on-the-ground sentiment, it suffered from inherent perception bias and large year-over-year fluctuations. A highly publicized port strike or a sudden political scandal could disproportionately tank a country's score, even if the underlying physical infrastructure remained highly capable. Furthermore, human memory tends to anchor on recent negative experiences rather than average daily performance.[1][3]
While the survey method successfully captured on-the-ground sentiment, it suffered from inherent perception bias and large year-over-year fluctuations.
The transition to big data strips away this subjectivity, replacing "vibes" with verifiable timestamps. The new framework comprises 21 objective indicators, including highly granular metrics like "container import dwell time" and "aviation import dwell time." If a cargo plane lands in a developing nation and the goods take six days to clear the tarmac, the data records the exact delay without human intervention or political smoothing.[1][5]
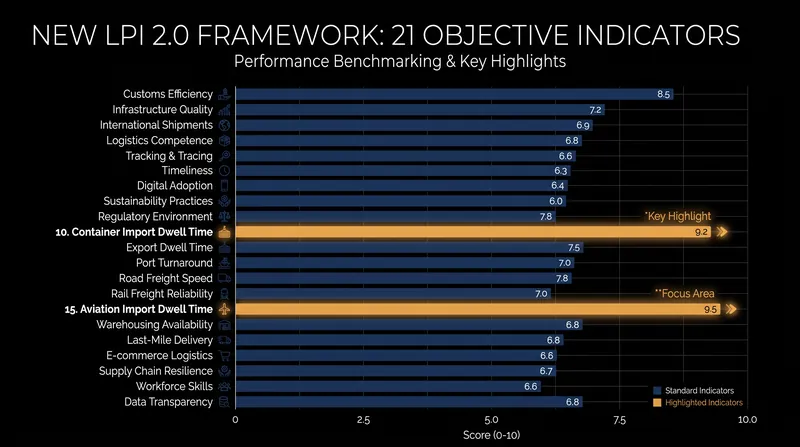
Applying this objective lens has immediately exposed stark realities about global trade networks. The LPI 2.0 data reveals persistent connectivity gaps between high-income and lower-income economies that surveys previously smoothed over. The tracking data shows that high unpredictability is heavily concentrated at specific nodes: seaports, transshipment hubs, and inland border checkpoints.[1]
The data has been particularly illuminating regarding the structural disadvantages faced by landlocked developing countries and small island states. While direct maritime connections significantly improve lead times, the tracking data proves that many low- and middle-income countries struggle with excessive import dwell times primarily due to inefficient, paper-based customs processes rather than a lack of physical roads or cranes.[1]

However, the shift to pure data is not without its blind spots. While a timestamp can definitively prove that a container sat at a port for ten days, it cannot explain why it sat there. The data alone cannot distinguish between a delay caused by a broken gantry crane, a corrupt customs official demanding a bribe, or a sudden change in tariff regulations.[3][5]
Ultimately, the evolution from LPI 1.0 to LPI 2.0 represents a broader trend in economic analysis: the move from asking people what is happening to watching the digital exhaust of the economy in real-time. By shifting the focus from perceptions to observed outcomes, the new framework enables governments to target their infrastructure investments with surgical precision, addressing the exact bottlenecks that slow down global commerce.[4][7]
Viewpoints in depth
Big Data Tracking (LPI 2.0)
The argument that objective, timestamped shipment data provides a superior, bias-free foundation for global trade policy.
**For:** Eliminates human perception bias, offers real-time granularity, and captures over 80% of global goods trade through automated platforms. **Against:** Fails to capture the 'why' behind delays—such as corruption or regulatory hurdles—and struggles to measure informal logistics networks common in developing economies. **Evidence:** The LPI 2.0 utilizes 21 objective indicators, replacing a 1,000-person survey with millions of automated data points from MarineTraffic and Cargo iQ. **Fits well when:** Policymakers need to pinpoint exact physical bottlenecks, measure the direct impact of a new port terminal, or benchmark precise container dwell times against neighboring countries. **Does not fit when:** Researchers are trying to diagnose the root causes of delays related to human behavior, bribery, or complex regulatory friction.
Survey-Based Measurement (LPI 1.0)
The argument that human experience and qualitative assessment capture essential friction points that raw data misses.
**For:** Captures the lived reality of navigating a country's logistics network, including the ease of arranging shipments, the competence of local operators, and the hidden costs of doing business. **Against:** Highly subjective, prone to recency bias, and limited by a small global sample size. **Evidence:** For 15 years, the survey-based LPI successfully guided billions in World Bank development funding by highlighting 'soft' infrastructure issues like customs corruption that sensors cannot detect. **Fits well when:** Assessing the overall business climate, measuring the perceived competence of logistics service providers, or evaluating the 'soft' friction of trade regulations. **Does not fit when:** Requiring precise, reproducible metrics for infrastructure efficiency, or when trying to eliminate political and emotional bias from national rankings.
What we don’t know
- How the World Bank will account for informal, non-digitized logistics networks that handle significant domestic trade in developing economies.
- Whether the shift to objective data will alter the allocation of international development funding for infrastructure projects.
Sources
Source coverage
7 outlets
3 viewpoints surfaced







[1]World BankData-Driven Economists
The New Logistics Performance Indicators 2.0 (LPI 2.0): Methodology and User Guide
Read on World Bank →[2]MDPI Applied SciencesDeveloping Economy Policymakers
Evaluating Logistics Performance Using an Integrated MCDM Model
Read on MDPI Applied Sciences →[3]ZenodoQualitative Trade Analysts
Comparative analysis: traditional and revised LPI methodologies
Read on Zenodo →[4]RePEcData-Driven Economists
From Survey to Big Data : The New Logistics Performance Index
Read on RePEc →[5]Scientists.uzDeveloping Economy Policymakers
Structural changes in LPI: moving from survey-based assessments to a data-driven system
Read on Scientists.uz →[6]WikipediaQualitative Trade Analysts
Logistics Performance Index
Read on Wikipedia →[7]Factlen Editorial Team
Synthesis by Factlen editorial team
Read on Factlen Editorial Team →
Comments

More in data analysis
See all 5 stories →


Every angle. Every day.
Get data analysis stories with full source coverage and perspective breakdowns delivered to your inbox.