
The Total Cost of Ownership: A Systematic Comparison of Electric Vehicles vs. Internal Combustion Engine Cars
A cross-market analysis of upfront premiums, maintenance savings, and energy costs reveals how the financial break-even point between electric and combustion vehicles has shifted.

Share this story
At 12,000 miles per year, a passenger vehicle consumes roughly 400 gallons of gasoline or 3,500 kilowatt-hours of electricity—a fundamental energy divergence that dictates the financial architecture of modern transportation. For decades, the internal combustion engine offered a low barrier to entry paired with steady, predictable operational bleeding. The electric vehicle flips this model entirely, demanding higher initial capital in exchange for structurally lower operating costs over the lifespan of the asset.[1]
Assessing the true cost of these competing architectures requires moving beyond sticker prices and examining the Total Cost of Ownership (TCO). TCO aggregates depreciation, financing, insurance, maintenance, repairs, taxes, and fuel over a vehicle's operational life. When viewed through this systems-level lens, the economic narrative of the EV transition shifts from a premium luxury purchase to a front-loaded infrastructure investment.[3]
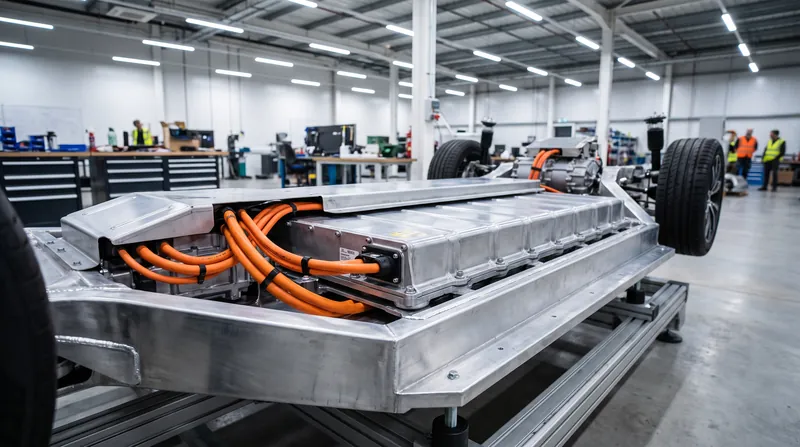
The upfront capital requirement remains the most visible friction point. Across major global markets, battery-electric vehicles carry an average price premium of $4,500 to $6,000 over their direct combustion counterparts, prior to government incentives. This gap is driven entirely by the battery pack, a dense electrochemical storage system that still commands a significant premium at the pack manufacturing level.[2]
However, this initial premium buys access to a fundamentally cheaper energy ecosystem. Electricity, particularly when sourced from residential grids during off-peak hours, costs a fraction of refined petroleum per mile driven. In the United States, replacing a 30-mpg gas car with an EV yielding 3.5 miles per kilowatt-hour generates annual energy savings between $800 and $1,200, depending heavily on regional utility rates.[4]
Maintenance costs introduce the second major structural divergence between the two platforms. An internal combustion engine relies on thousands of moving parts, pressurized fluids, and high-heat exhaust systems that degrade predictably over time. Electric powertrains eliminate oil changes, spark plugs, timing belts, and transmission fluid flushes, stripping away the most common recurring service intervals.[3]
Furthermore, regenerative braking systems in EVs use the electric motor to decelerate the vehicle, capturing kinetic energy and returning it to the battery. This mechanism drastically reduces wear on traditional friction brakes, often extending the life of brake pads beyond 100,000 miles. Consequently, routine maintenance costs for EVs track 40% to 50% lower than comparable internal combustion vehicles over a standard five-year horizon.[1]
When these operational savings are aggregated, the financial trajectories of the two architectures inevitably cross. The break-even point—the moment cumulative EV savings eclipse the initial purchase premium—has compressed significantly. Normalizing data across the US, Germany, and Thailand reveals an average global break-even timeline of 3.8 years for drivers covering 12,000 miles annually.[6]
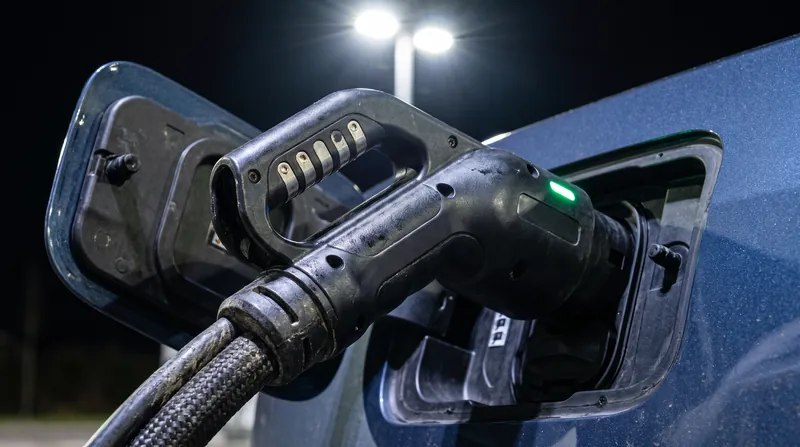
This 3.8-year threshold, however, is highly elastic and deeply dependent on infrastructure access. The economic advantage of the EV architecture relies almost entirely on residential Level 2 charging. When drivers are forced to rely on public DC fast-charging networks, the cost per kilowatt-hour often doubles or triples, eroding the energy arbitrage and pushing the break-even point past seven years.[2]
Depreciation represents the largest and most volatile component of TCO for both platforms. Historically, EVs suffered steeper depreciation curves due to rapid technological obsolescence and consumer anxiety regarding battery degradation. A five-year-old EV often lacked the range and charging speed of newer models, depressing its residual value on the secondary market.[3]
This trend is beginning to stabilize as battery chemistries mature and ranges normalize above 250 miles. Modern thermal management systems and advanced battery management software have proven capable of limiting capacity loss to less than 10% over 100,000 miles. As real-world data validates these lifespans, EV residual values are slowly aligning with the broader automotive market, reducing the TCO penalty associated with early adoption.[5]
Insurance premiums introduce a distinct headwind for the EV TCO equation. Insurers frequently charge 10% to 15% more to cover electric vehicles, citing the high cost of specialized repairs and the risk of battery pack replacement following minor collisions. A minor structural impact that damages the battery enclosure can total an EV, a risk profile that actuaries price directly into monthly premiums.[1]
Taxation structures are also evolving, altering the long-term TCO balance. Because EVs do not consume gasoline, they bypass the fuel taxes that traditionally fund highway maintenance. In response, dozens of jurisdictions have implemented flat annual EV registration fees, which can offset a portion of the anticipated energy savings and alter the break-even calculus for low-mileage drivers.[5]
In emerging markets, the TCO comparison is heavily influenced by import tariffs and local supply chains. In Thailand, for example, government subsidies and aggressive tax restructuring have artificially accelerated the EV break-even point, making electric architectures competitive with ICE vehicles from day one for certain vehicle classes and commercial fleet applications.[5]
Conversely, in markets with high electricity costs and heavily subsidized fossil fuels, the internal combustion engine retains a durable economic advantage. The ICE architecture remains the most financially rational choice for low-mileage drivers, those without reliable home charging, and operators in regions with fragile electrical grids where charging costs are unpredictable.[2]
Ultimately, the total cost of ownership is not a static metric but a dynamic equation shaped by individual use cases. The transition from combustion to electric propulsion represents a shift from variable operational costs to fixed capital investments. For the high-mileage driver with a driveway, the EV is a deflationary asset; for the urban apartment dweller, the ICE remains a necessary economic compromise.[6]
Viewpoints in depth
Electric Vehicle Architecture
High upfront capital investment offset by structurally lower energy and maintenance costs.
For: Dramatically lower per-mile energy costs, 40-50% reduction in routine maintenance, zero tailpipe emissions, and superior long-term reliability due to fewer moving parts. Against: Higher initial purchase price, reliance on charging infrastructure, elevated insurance premiums, and potential for rapid depreciation if battery technology advances abruptly. Evidence: Cross-market data indicates a 3.8-year break-even point for drivers averaging 12,000 miles annually with home charging access. Guidance: Fits well when the owner has reliable overnight residential charging, drives above-average annual mileage, and plans to keep the vehicle beyond the four-year mark. Does not fit when the driver relies exclusively on public fast-charging networks or drives fewer than 5,000 miles per year.
Internal Combustion Engine Architecture
Lower barrier to entry paired with predictable, higher long-term operational expenses.
For: Lower initial purchase price, ubiquitous refueling infrastructure, established secondary market with predictable depreciation, and lower insurance premiums. Against: High vulnerability to geopolitical fuel price shocks, expensive routine maintenance (oil, belts, brakes), and increasing regulatory pressure via emissions taxes. Evidence: ICE vehicles maintain a clear TCO advantage in the first three years of ownership and in regions where electricity prices exceed $0.25 per kWh while gasoline remains subsidized. Guidance: Fits well when upfront capital is constrained, annual mileage is low, or the driver lacks access to dedicated home charging infrastructure. Does not fit when the vehicle is used for high-mileage commuting or fleet operations where fuel and maintenance costs compound rapidly.
- Total Lifecycle Optimizers
- Focuses on long-term capital efficiency, prioritizing lower operating costs and maintenance savings over initial purchase price.
- Upfront Capital Constrained
- Prioritizes immediate affordability, lower insurance premiums, and avoiding the high initial sticker price of battery technology.
- Infrastructure Skeptics
- Highlights the hidden costs of public charging dependency and the risk of rapid depreciation due to battery degradation.
Sources
Source coverage
6 outlets
3 viewpoints surfaced



- [1]Journal of Industrial EcologyTotal Lifecycle Optimizers
Electric and gasoline vehicle total cost of ownership across US cities
Read on Journal of Industrial Ecology → - [2]Sustainability (MDPI)Upfront Capital Constrained
Total Cost of Ownership and External Cost Assessment of Commercially Available Vehicles in Germany
Read on Sustainability (MDPI) → - [3]The Journal of EngineeringInfrastructure Skeptics
Total Cost of Ownership of Electric Vehicles: A Synthesis of Critical Factors
Read on The Journal of Engineering → - [4]Energy InnovationTotal Lifecycle Optimizers
Most Electric Vehicles Are Cheaper Off the Lot Than Gas Cars From Day One
Read on Energy Innovation → - [5]Energy ReportsUpfront Capital Constrained
Total cost of ownership of internal combustion engine and electric vehicles: A real-world comparison for the case of Thailand
Read on Energy Reports → - [6]Factlen Editorial Team
Synthesis by Factlen editorial team
Read on Factlen Editorial Team →
More in Transportation
See all →Battery Management
The State of Charge and Temperature Limits: How EV Battery Management Systems Cap Regenerative Braking Power
7 sources
Motor Architecture
Axial Flux vs. Radial Flux Motors: The Trade-Offs Defining Next-Generation EV Performance
7 sources

Battery Chemistry
Balancing EV Fast Charging Between Continuous SEI Growth and Acute Lithium Plating
9 sources

Urban EV Infrastructure
Curbside Level 2 vs. Centralized DC Fast Hubs: How Cities Are Resolving the Urban EV Charging Bottleneck
7 sources

Comments
Every angle. Every day.
Get Transportation stories with full source coverage and perspective breakdowns, free every day.