
Measuring Maritime Chokepoints: How Turnaround Time, Crane Moves, and Berth Occupancy Dictate Port Efficiency
Three core metrics determine whether a global container port functions as a seamless logistics node or a supply chain bottleneck. Understanding how vessel turnaround time, crane productivity, and berth utilization interact reveals the hidden math governing international trade.

Share this story
In short
- Vessel turnaround time measures the total duration a ship spends in port, directly impacting a carrier's bottom line.
- Crane moves per hour dictate the speed of cargo operations, with modern cranes targeting 25 to 30 moves hourly.
- Berth occupancy rates above 70 percent trigger exponential delays, as arriving ships are forced to wait at anchorage.
In 2023, the average container ship spent 0.97 days in port globally, according to the United Nations Conference on Trade and Development. That roughly 23-hour window represents the most critical and vulnerable node in the international supply chain, the exact point where maritime transport meets terrestrial logistics. Whether a vessel departs on schedule or triggers a cascading delay across the Pacific depends entirely on how a terminal manages three intersecting variables: vessel turnaround time, crane moves per hour, and berth occupancy.[1]
Vessel Turnaround Time (VTT) serves as the ultimate macro-metric of port performance. It measures the total duration a ship spends within a port's jurisdiction, beginning the moment a marine pilot boards the vessel at the outer anchorage and ending when the pilot disembarks after outbound transit. For ocean carriers, VTT is the only metric that directly impacts their bottom line, as a ship only generates revenue when it is moving cargo across the ocean, not when it is tied to a concrete wall.[4]
The turnaround metric breaks down into three distinct phases: waiting time at anchorage, berthing time (the physical maneuvering), and working time at the quay. Guidelines published by Fundación Valenciaport indicate that working time should ideally constitute at least 80 percent of the total turnaround duration.
When congestion builds, however, waiting time inflates disproportionately, destroying the ratio and forcing carriers to burn additional fuel steaming at higher speeds to the next port to maintain their published weekly schedules. This cascading effect highlights why isolated delays at a single major hub can disrupt vessel spacing across an entire ocean network.[5]
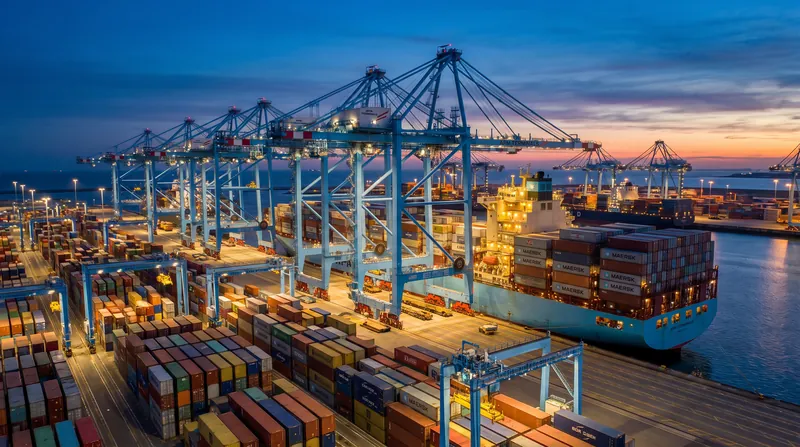
During that critical working time, Crane Moves Per Hour (CMPH) becomes the primary micro-metric governing the operation. This measures the raw mechanical output of the ship-to-shore (STS) gantry cranes lifting boxes on and off the vessel. A standard modern STS crane is engineered to achieve 25 to 30 moves per hour under optimal conditions. Multiplying that rate by the number of cranes deployed on a single ship provides the gross berth productivity, dictating exactly how many hours the vessel must remain tied up.[2]
The relationship between these machines and the wider network is absolute. "The productivity of quay cranes directly dictates the duration of the vessel's stay at the berth," notes the MDPI assessment of seaport efficiency determinants. If a terminal promises a carrier 100 moves per hour across four cranes, but only delivers 75 due to mechanical faults or labor shortages, a planned 20-hour port call stretches to nearly 27 hours, instantly jeopardizing the vessel's departure window and subsequent arrival at the next destination.[3]
However, a terminal cannot simply solve turnaround delays by crowding more cranes onto a single hull. The scaling of crane deployment faces strict physical limits and diminishing returns. Interference between the ground gangs operating below the cranes, coupled with the structural spacing of the ship's cargo bays, limits the maximum effective deployment to about four or five cranes for a standard New Panamax vessel. Pushing beyond that density often reduces the individual efficiency of each crane, yielding no net gain in overall vessel speed.[3]
While carriers focus obsessively on turnaround time and crane speed, terminal operators manage their capital through Berth Occupancy Rate (BOR). This utilization metric is calculated by dividing the total time a port's berths are occupied by vessels by the total time those berths are available over a given period. Because building a new deep-water quay requires hundreds of millions of dollars in capital expenditure and years of environmental permitting, port authorities are heavily incentivized to maximize the utilization of their existing concrete infrastructure.[5]
This creates a structural tension between the port and the ship, governed by the mathematical realities of queuing theory. While a 100 percent occupancy rate sounds like perfect asset utilization to a financial auditor, in maritime logistics, it guarantees catastrophic delays. Valenciaport's performance indicators suggest a maximum optimal BOR of 65 percent to 70 percent for a standard multi-user container terminal. Leaving 30 percent of the berth empty is not a waste of space; it is the necessary shock absorber that accommodates vessels arriving off-schedule due to weather.[5]
When occupancy pushes beyond that 70 percent threshold, vessels arrive to find no available berth, immediately spiking the waiting time component of their turnaround metric. The OECD's analysis of world port efficiency highlights that facilities operating consistently above this utilization threshold see exponential, rather than linear, increases in anchorage wait times.
The system shifts from a fluid state to a congested state, where every minor delay on the quay amplifies the queue of ships waiting in the harbor. This dynamic explains why seemingly minor disruptions can trigger massive offshore traffic jams.[1]
Geopolitical shocks routinely test the limits of these three metrics. An RSIS International working paper analyzing the supply chain impact of the US-China trade war demonstrated how sudden volume shifts to Southeast Asian ports pushed berth occupancy past 85 percent in emerging hubs like Vietnam.
Because the infrastructure could not expand fast enough to meet the redirected trade flows, the high occupancy rates collapsed crane efficiency, as the terminal yards filled up with boxes waiting for export. The resulting congestion proved that high demand without adequate buffer capacity actively degrades operational speed.
The breakdown occurs in the intermediate zone between the ship and the gate. "When yard utilization exceeds 80 percent, the terminal loses the buffer space required to stage export containers, slowing down the quay cranes," the RSIS researchers observed. If a crane operator has to wait for a yard tractor to navigate a congested stack, the moves per hour plummet. The quay crane, despite being mechanically capable of 30 moves an hour, drops to 15, doubling the vessel's turnaround time despite the terminal being fully staffed.
To break this dependency, the industry is increasingly turning to automation. Automated stacking cranes (ASCs) and automated guided vehicles (AGVs) attempt to decouple yard congestion from quay crane productivity.
By using software to optimize the exact placement and retrieval of every container in the yard, automated terminals can maintain high crane moves per hour even when berth occupancy and yard density approach their theoretical maximums, effectively rewriting the traditional queuing theory curves that have historically governed port design. This capital-intensive approach aims to provide both high asset utilization for the operator and reliable speed for the carrier.[2]
A secondary variable disrupting these metrics is the relentless inflation of vessel size. As ocean carriers deploy megaships capable of carrying 24,000 TEU, the mathematical relationship between turnaround time, crane moves, and occupancy fractures. A megaship requires significantly more total crane moves to discharge and load its cargo, extending the absolute berthing time required for a single call. This artificially inflates the terminal's berth occupancy rate, which in turn delays smaller feeder vessels that must wait longer for the massive ship to clear the quay.[4]
Because a 24,000 TEU vessel is wider and deeper, it also restricts which specific berths and cranes can be utilized. Only the largest Super Post-Panamax cranes can reach across 24 rows of containers. If a port only has three of these massive cranes, the gross moves per hour are hard-capped, meaning the megaship might spend four days alongside the berth.
This extended turnaround time forces the carrier to deploy more vessels into the network just to maintain a weekly sailing schedule, erasing some of the economies of scale the larger ship was supposed to provide.[1]
The next verifiable checkpoint for port efficiency will be the widespread adoption of predictive arrival systems and just-in-time steaming. By sharing real-time terminal data with approaching vessels, carriers can adjust their steaming speeds in the middle of the ocean to match exact berth availability.
If a ship knows the berth will not be open until Thursday morning, it slows down, saving fuel and reducing emissions, rather than racing to the port only to drop anchor and inflate its waiting time. This digital integration aims to reduce the waiting component of turnaround time to zero, fundamentally altering how global maritime efficiency is calculated.[3]
Jargon, explained
- TEU
- Twenty-foot Equivalent Unit, the standard measure of volume in container shipping, representing one standard 20-foot shipping container.
- Ship-to-Shore (STS) Crane
- The massive gantry cranes located on the edge of the dock that lift containers directly between the vessel and the terminal yard.
- Quay
- The concrete structure or platform lying alongside the water where ships tie up to load and unload cargo.
- Berth Occupancy Rate (BOR)
- The percentage of total available time that a port's berths are physically occupied by vessels.
- New Panamax
- A size class of ships designed to fit exactly through the expanded locks of the Panama Canal, typically carrying around 14,000 TEU.
Common questions
What is vessel turnaround time?
It is the total time a ship spends in a port, from the moment a pilot boards at the anchorage to the moment the ship departs the port limits.
Why can't ports just add more cranes to a ship to speed it up?
Physical spacing limits how many cranes can operate simultaneously. Deploying more than four or five cranes on a standard vessel causes the ground crews to interfere with each other, reducing overall efficiency.
What is a good berth occupancy rate?
For a multi-user container terminal, the optimal berth occupancy rate is between 65 and 70 percent. Higher rates lead to exponential increases in vessel waiting times.
How do megaships affect port efficiency?
Megaships require more total crane moves and longer berthing times, which inflates berth occupancy and can force smaller vessels to wait longer for access to the quay.
Competing readings
Terminal Operators
Terminal management focuses on maximizing the utilization of expensive infrastructure.
For port authorities and private terminal operators, the primary metric of success is the Berth Occupancy Rate. Constructing a deep-water quay and equipping it with Super Post-Panamax cranes requires hundreds of millions of dollars in upfront capital. To generate a return on that investment, the infrastructure must be utilized as constantly as possible. Operators view empty berths as lost revenue, driving a structural incentive to push occupancy rates toward 80 percent, even if that density occasionally forces arriving vessels to drop anchor and wait.
Ocean Carriers
Shipping lines prioritize speed and predictability to maintain their global network schedules.
Ocean carriers view port calls strictly as a cost center. Their revenue is generated while the vessel is moving cargo across the ocean. Consequently, their focus is entirely on Vessel Turnaround Time and Crane Moves Per Hour. Carriers require terminals to maintain enough buffer capacity—meaning lower berth occupancy—to guarantee immediate berthing upon arrival. When high occupancy at a terminal causes a 12-hour delay, the carrier must burn significantly more fuel steaming to the next port to make up the lost time, directly eroding the voyage's profitability.
Beneficial Cargo Owners
The companies actually shipping the goods focus on end-to-end transit reliability rather than specific maritime metrics.
For retailers and manufacturers, the internal metrics of the port are secondary to the overall predictability of the supply chain. A cargo owner does not care if a vessel achieved 30 crane moves per hour if the container then sits in a congested terminal yard for five days waiting for a truck chassis. This perspective highlights the risk of optimizing maritime metrics in isolation; if high crane productivity simply moves the bottleneck from the quay to the terminal gate, the ultimate delivery schedule remains compromised.
- Terminal Operators
- Prioritize high berth occupancy to maximize the return on capital invested in expensive port infrastructure.
- Ocean Carriers
- Prioritize rapid vessel turnaround time and high crane moves per hour to maintain network schedules and reduce fuel costs.
- Logistics Systems Analysts
- Focus on the mathematical interaction between yard density, automation, and overall supply chain fluidity.
Perspectives this story doesn't cover
- Port Labor Unions
- Local Environmental Regulators
Sources
Source coverage
6 outlets
3 viewpoints surfaced






- [1]OECDTerminal Operators
Efficiency of World Ports in Container and Bulk Cargo (oil, coal, ores and grain)
Read on OECD → - [2]Emerald PublishingOcean Carriers
Port productivity: benchmarking analysis of strategic ports
Read on Emerald Publishing → - [3]MDPILogistics Systems Analysts
An Assessment of Container Seaport Efficiency Determinants
Read on MDPI → - [4]ResearchGateOcean Carriers
Ships time in port
Read on ResearchGate → - [5]Fundación ValenciaportTerminal Operators
PERFORMANCE INDICATORS IN CONTAINER TERMINALS
Read on Fundación Valenciaport → - [6]Factlen Editorial TeamLogistics Systems Analysts
Synthesis by Factlen editorial team
Read on Factlen Editorial Team →
More in Transportation
See all →Maritime Safety
Water Density Differentials and a 1/48th Draft Margin: How the 1966 Load Line Convention Calculates Plimsoll Freeboard Marks
9 sources
Maritime Law
York-Antwerp Rules: Sharing the Cost of Sacrificed Cargo in Maritime Emergencies
7 sources
Aviation Safety
Embraer and Honeywell Open Crisis Room After GPS Fault Disrupts Global E2 Jet Fleet
7 sources
Ammonia Bunkering
World's First Ammonia Ship-to-Ship Bunkering Completed in Japan
7 sources
Comments
Every angle. Every day.
Get Transportation stories with full source coverage and perspective breakdowns, free every day.