
How Discount Rates and Capacity Factors Skew the Levelized Cost of Energy
Policymakers frequently cite the Levelized Cost of Energy to declare one power source cheaper than another. However, the metric's heavy reliance on assumed discount rates and capacity factors often obscures the true financial and operational costs of generating electricity.

- System Planners
- Argue that LCOE is fundamentally flawed for grid-level planning because it ignores integration costs and the temporal value of electricity.
- Renewable Advocates
- Emphasize that despite its flaws, LCOE accurately captures the massive deflationary trend in wind and solar hardware.
- Energy Economists
- Focus on the distortionary effects of discount rates and capital costs, noting that financial assumptions often predetermine cost comparisons.
Perspectives this story doesn't cover
- Ratepayers
- Transmission Developers
Common questions
What does the discount rate represent in energy modeling?
The discount rate represents the cost of capital and the time value of money. It accounts for the fact that investors require a return on their upfront capital, making future revenues worth less than money held today.
Why is LCOE criticized for variable renewables?
LCOE assumes all electricity generated has the same value, regardless of when it is produced. It also ignores the system-level costs of integrating intermittent power, such as battery storage and transmission upgrades.
What is the difference between LCOE and LACE?
LCOE measures the cost to generate a megawatt-hour of electricity, while LACE (Levelized Avoided Cost of Energy) measures the value that electricity provides to the grid by calculating the cost of the generation it displaces.
The short answer
- The Levelized Cost of Energy (LCOE) reduces a power plant's lifetime expenses into a single dollar-per-megawatt-hour figure.
- Capital-intensive projects like nuclear and offshore wind are highly sensitive to the assumed discount rate.
- LCOE treats all megawatt-hours identically, ignoring the fact that evening power is often more valuable than midday power.
- Grid planners increasingly use alternative metrics like LACE to measure the actual system value of new generation.
Energy developers and political leaders routinely point to the Levelized Cost of Energy as the definitive proof that renewable power has permanently undercut fossil fuels. By reducing the lifetime expenses of a power plant into a single dollar-per-megawatt-hour figure, the metric presents a clean, easily digestible verdict on grid economics. Yet, energy economists and grid operators argue this single number is fundamentally deceptive. The evidence shows that LCOE is not a fixed physical property of a power plant, but a highly sensitive financial model where minor tweaks to discount rates, capacity factors, and capital costs can entirely flip the economic winner.[5][7]
The formula itself is straightforward in theory. It divides the total lifetime cost of building and operating a power plant by the total amount of electricity it will generate over its operational life. The U.S. Energy Information Administration defines it formally, noting that the metric represents the per-kilowatt hour cost of building and operating a generating plant over an assumed financial life and duty cycle. The resulting figure represents the minimum price at which electricity must be sold for the project to break even.[2][4]
However, the inputs required to calculate that figure are heavily dependent on assumptions. The most volatile of these is the discount rate, which represents the cost of capital and the time value of money. Because a dollar earned today is worth more than a dollar earned in 20 years, future revenues and costs must be discounted to their present value. This financial mechanism disproportionately impacts different types of generation.[3]
For capital-intensive projects like nuclear reactors or offshore wind farms, the discount rate dictates the final LCOE more than the actual cost of the steel and silicon. The International Energy Agency notes in its 2020 analysis that shifting the discount rate from 3 percent to 10 percent can nearly double the LCOE of a nuclear facility, simply because the massive upfront capital costs are financed over decades.[3]
Conversely, natural gas plants, which have lower upfront capital costs but high ongoing fuel expenses, are far less sensitive to the discount rate. When analysts compare a wind farm to a gas plant, the assumed cost of capital can predetermine the outcome of the comparison before a single turbine is modeled. A low discount rate heavily favors renewables, while a high discount rate makes fossil fuels appear more competitive.[5][7]
The second critical input is the capacity factor, which measures the ratio of the actual electrical energy output over a given period to the maximum possible electrical energy output. A combined-cycle natural gas plant might have a theoretical capacity factor of 85 percent, assuming it runs almost constantly and pauses only for scheduled maintenance.[4]
Wind and solar resources, constrained by weather and daylight, operate at much lower capacity factors. The U.S. Energy Information Administration models utility-scale solar with capacity factors hovering around 30 percent, while onshore wind typically models between 40 and 50 percent depending on the geographic region.[2]
Wind and solar resources, constrained by weather and daylight, operate at much lower capacity factors.
If a modeler assumes a slightly higher capacity factor for a solar array, perhaps by assuming tracking panels in a highly irradiated desert environment, the denominator in the LCOE equation grows, driving the final cost per megawatt-hour down. The Initiative for Climate Action Transparency warns that applying global average capacity factors to local projects routinely results in wildly inaccurate cost projections.
Capital costs, the third pillar of the calculation, introduce their own distortions. The International Renewable Energy Agency reported in its July 2026 update that the global weighted average capital cost for utility-scale solar continues to fall, driven by manufacturing scale and supply chain optimization. This hardware deflation is the primary driver behind the celebrated drop in renewable LCOE over the last decade.[1]
But overnight capital cost, the price to build the plant if it could be constructed instantly, ignores the realities of construction delays and financing timelines. A project that takes 10 years to build accrues massive interest before it generates a single electron, a reality that overnight cost models often fail to capture accurately when comparing fast-deploying solar to slow-deploying nuclear or hydro.[4][5]
Beyond the internal inputs, LCOE faces severe criticism for what it entirely excludes. The Energy for Growth Hub highlights that the metric assumes all megawatt-hours are equally valuable, regardless of when they are generated. This assumption breaks down in modern grids with high penetrations of variable generation.[5]
Electricity produced by a solar panel at noon in a saturated market may have a wholesale value of zero, or even trigger negative pricing, while power generated by a gas turbine during a 7:00 PM winter peak is highly valuable. LCOE treats both megawatt-hours identically, ignoring the temporal value of energy and overstating the economic utility of bulk daytime solar.[5][7]
Furthermore, the metric ignores integration costs. When a grid adds variable renewable energy, it must also invest in transmission upgrades, battery storage, and standby dispatchable generation to maintain frequency and reliability. These system-level costs are borne by the grid operator and ultimately the ratepayer, but they do not appear in the LCOE of the individual wind or solar farm.[6][7]
As the International Renewable Energy Agency's May 2026 analysis of firm renewables indicates, calculating the cost of delivering 24/7 matched clean energy yields a significantly higher figure than the raw LCOE of the generation assets alone. When storage and overbuilding are factored in to guarantee continuous output, the cost profile changes dramatically.[6]
To address these blind spots, energy modelers are increasingly turning to alternative metrics, such as the Levelized Cost of Storage and the Levelized Avoided Cost of Energy. LACE attempts to quantify the value a new power plant provides to the grid by calculating the cost of the generation it displaces.[2]
When LACE exceeds LCOE, a project is considered economically viable, as it provides more value than it costs to build and operate. This dual-metric approach prevents developers from building cheap generation that the grid does not actually need at the time it produces power.[2]
The U.S. Energy Information Administration now routinely publishes LACE alongside LCOE to provide a more complete picture of asset viability. As grids approach higher penetrations of variable generation, the gap between what a megawatt-hour costs to produce and what it costs to integrate will dictate the next decade of infrastructure investment.[2][7]
Why it matters
Trillions of dollars in global grid investments are guided by LCOE comparisons. Understanding the blind spots in this metric is essential for ratepayers and policymakers who must balance the transition to clean energy with the physical realities of grid reliability.
Jargon, explained
- Levelized Cost of Energy (LCOE)
- The minimum average price at which electricity must be sold for a power plant to break even over its operational lifetime.
- Discount Rate
- The interest rate used to determine the present value of future cash flows, reflecting the cost of capital and investment risk.
- Capacity Factor
- The ratio of a power plant's actual electrical output over a period of time to its maximum potential output if it operated continuously.
- Levelized Avoided Cost of Energy (LACE)
- A metric that estimates the financial value a new power plant provides to the grid by displacing the need to run more expensive existing generators.
Sources
Source coverage
7 outlets
3 viewpoints surfaced






- [1]IRENARenewable Advocates
Renewable power generation costs in 2025
Read on IRENA → - [2]U.S. Energy Information AdministrationSystem Planners
Levelized Costs of New Generation Resources in the Annual Energy Outlook 2026
Read on U.S. Energy Information Administration → - [3]International Energy AgencySystem Planners
Projected Costs of Generating Electricity 2020 – Analysis
Read on International Energy Agency → - [4]OpenEIEnergy Economists
Levelized Cost of Energy
Read on OpenEI → - [5]Energy for Growth HubEnergy Economists
LCOE and its Limitations
Read on Energy for Growth Hub → - [6]IRENARenewable Advocates
24/7 renewables: The economics of firm solar and wind
Read on IRENA → - [7]Factlen Editorial TeamEnergy Economists
Synthesis by Factlen editorial team
Read on Factlen Editorial Team →
Comments

More in Energy
See all →AI Power Grid
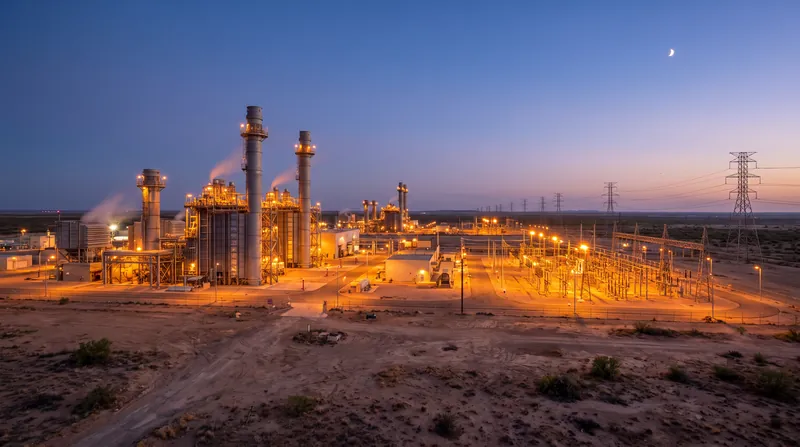
South Korea Nears $100 Billion US Energy Investment for AI Infrastructure
4 sources
Grid Reliability
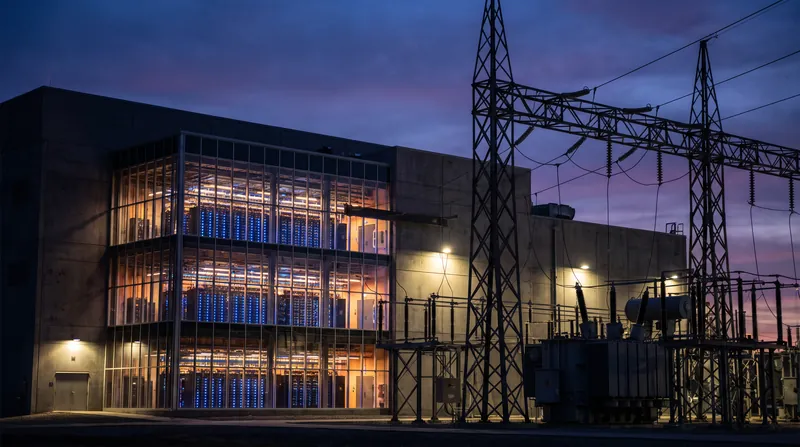
Utilities and Regulators Clash Over Grid Costs as Data Center Load Forecasts Surge
6 sources
Waste Management
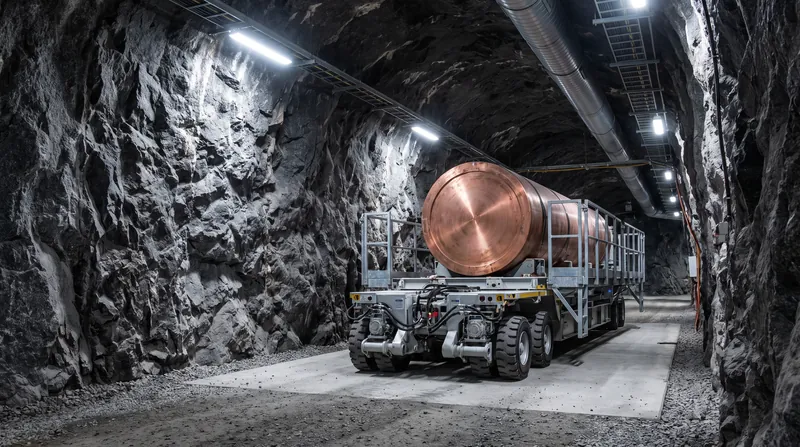
How the 30-Year Half-Lives of Cesium-137 and Strontium-90 Dictate Nuclear Waste Storage Duration
5 sources
Grid Capacity
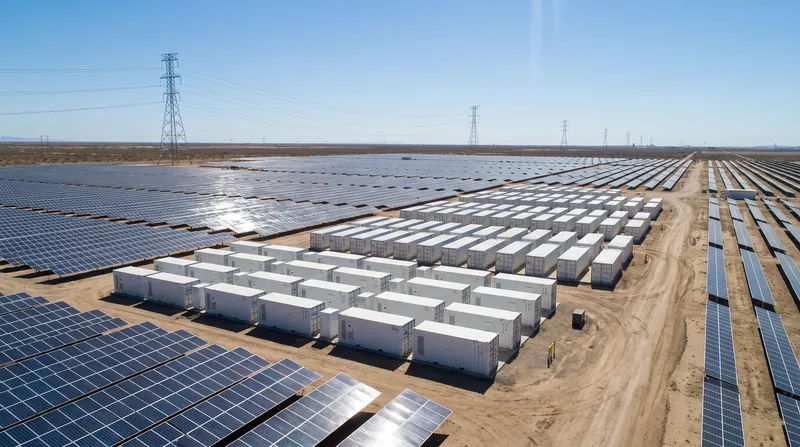
EIA Forecasts 99% of New US Electric Capacity in 2026 Will Be Renewables and Battery Storage
7 sources
Every angle. Every day.
Get Energy stories with full source coverage and perspective breakdowns delivered to your inbox.