
Global Port Congestion Hits Four-Year High, Driving Container Freight Rates to Third-Highest Peak in History
A perfect storm of early peak-season demand and lingering route diversions has tied up 11% of the global shipping fleet. Here is how supply chains are adapting to the highest freight rates since the pandemic era.
By Layla Zaher

Share this story
The global maritime supply chain is currently navigating its most significant logistical bottleneck since the pandemic era. Across the world's busiest trade lanes, a confluence of robust consumer demand, geopolitical route diversions, and localized weather events has pushed global port congestion to a four-year high. As of mid-July 2026, approximately 11 percent of the entire global container fleet is tied up in port queues and anchorages, effectively removing massive amounts of capacity from the open market and forcing companies to rethink their shipping strategies.[1][2]
This operational friction has triggered a sharp upward trajectory in shipping costs, driving container freight rates to their third-highest peak in modern history. While current prices remain below the extraordinary spikes witnessed during the peak of the COVID-19 pandemic and the initial shock of the Red Sea crisis, the sustained elevation is reshaping how global trade flows. The Drewry World Container Index recently recorded spot rates from Shanghai to Rotterdam jumping 25 percent in a single week, while transpacific routes to Los Angeles surged past $4,500 per forty-foot equivalent unit.[2][5]
To understand the mechanics of this surge, it is essential to look at the foundational shift in global routing that began over a year ago. The prolonged diversion of vessels away from the Suez Canal and around the Cape of Good Hope has fundamentally altered the geometry of international shipping. This extended transit absorbs roughly 9 percent of global fleet capacity on any given day, stretching carrier networks thin, increasing fuel consumption, and leaving virtually no buffer for unexpected disruptions at major destination ports.[6]
Compounding this structural tightness is a massive, earlier-than-usual injection of cargo demand. Traditionally, the maritime peak season begins in late summer as retailers stock up for holiday shopping. This year, however, importers initiated a massive wave of front-loading beginning in May. Driven by a desire to hedge against potential autumn tariff implementations and to secure inventory ahead of anticipated supply chain snarls, this premature cargo surge overwhelmed terminal infrastructure before the traditional busy season even commenced, catching many logistics networks off guard.[5]
The physical manifestation of this demand shock is most visible at major Asian transshipment hubs. In Singapore, the world's premier maritime crossroads, vessels that typically berth upon arrival have recently faced waiting times stretching up to several days. The backlog is driven not just by export volumes, but by the complex choreography of transshipment—where cargo is transferred between massive mainline vessels and smaller regional feeder ships. When this delicate synchronization is disrupted, the entire regional network begins to slow down.[3]
When mainline vessels arrive off-schedule due to longer African routings, the carefully synchronized transfer of containers breaks down. Containers pile up in the terminal yards, increasing yard density to critical levels. Once a terminal yard becomes too full, the massive gantry cranes that move boxes lose their operational efficiency, slowing down the loading and unloading of every subsequent ship. This creates a cascading delay that ripples outward across the Pacific and Indian Oceans, eventually impacting port operations on entirely different continents and disrupting global schedules.[3]
The congestion is not isolated to Asia. In Northern Europe, major gateways like Rotterdam, Antwerp, and Hamburg are grappling with their own operational bottlenecks. Because ships are arriving in bunched groups rather than evenly spaced intervals, European terminals are experiencing sudden gluts of import containers. This places immense pressure on inland transport networks—trucks, barges, and freight trains—to clear the docks fast enough to make room for the next wave of arrivals, forcing logistics providers to scramble for available chassis and warehouse space.[4]
In the Mediterranean, the dynamic is slightly different but equally strained. Ports such as Barcelona and Valencia have seen massive spikes in volume as large vessels from East Asia offload cargo in the western Mediterranean for further distribution eastward. This redistribution strategy, designed to bypass the Red Sea, has transformed these ports into impromptu mega-hubs. It is testing the limits of their processing capacity and equipment availability, while simultaneously highlighting the remarkable adaptability of the European maritime infrastructure under intense, sustained pressure.[3]
In response to the tightening market, ocean carriers have aggressively deployed capacity management strategies. Shipping lines have successfully implemented a flurry of Peak Season Surcharges and General Rate Increases across major East-West corridors. By carefully managing the deployment of their vessels and occasionally blanking sailings to realign schedules, carriers have maintained a firm floor under the rising spot rates, ensuring that their networks remain financially viable even as operational costs soar due to longer transit times and elevated fuel consumption.[2]
Yet, a fascinating statistical anomaly is masking the true extent of the network friction: the phenomenon of negative delays. If one looks purely at headline schedule reliability metrics, the global fleet appears to be performing reasonably well. However, this is largely because carriers have systematically padded their published transit times to absorb the ongoing disruptions. By adjusting the baseline expectations, the industry has created an illusion of punctuality that obscures the reality of ships spending significantly more time at sea.
By building extra buffer days into their official schedules, carriers ensure that vessels increasingly arrive early or on time against their revised itineraries, even if the actual physical journey takes significantly longer than it did two years ago. This schedule padding has become a structural feature of modern liner operations, artificially reducing average delay figures while underlying network friction remains exceptionally high. For shippers, this means that while predictability has improved, the overall velocity of global trade has fundamentally slowed.
The current capacity crunch is occurring despite a historic influx of new vessels entering the global fleet. The container shipping orderbook remains robust, with millions of TEUs of new capacity delivering throughout the year. However, the sheer volume of capacity absorbed by the Cape of Good Hope diversions and the 11 percent of the fleet paralyzed by port congestion has effectively neutralized this new tonnage, keeping the supply-demand balance tightly coiled and preventing freight rates from naturally correcting downward.[1][6]
Looking forward, the industry faces a complex balancing act. If the early front-loading of cargo successfully pulls enough volume forward, the traditional late-summer peak season might prove softer than usual, allowing terminals to clear their backlogs and rates to stabilize. Conversely, if consumer demand remains robust and geopolitical routing remains static, the current congestion could cascade deeper into the year, requiring shippers to maintain highly elevated inventory buffers and continue paying premium rates to secure space on outbound vessels.[4][6]
Ultimately, the current shipping environment serves as a masterclass in supply chain adaptation. Logistics providers and shippers are no longer treating disruptions as black-swan anomalies, but as baseline operating conditions. By leveraging advanced predictive analytics, diversifying routing options, and engaging in proactive, early-stage capacity planning, the global trade ecosystem is proving its ability to keep the world's goods moving. This resilience ensures that while the cost of shipping has risen, the fundamental arteries of international commerce remain robust and fully functional.[4]
Key points
- Global port congestion has reached a four-year high, tying up approximately 11 percent of the world's container shipping fleet.
- Container freight rates have surged to their third-highest historical peak, driven by an unusually early peak season and front-loaded cargo.
- The prolonged diversion of vessels around the Cape of Good Hope continues to absorb roughly 9 percent of global shipping capacity.
- Major transshipment hubs in Asia and Europe are experiencing severe bottlenecks, increasing yard density and slowing vessel turnaround times.
What we don’t know
- Whether the early front-loading of cargo will result in a softer traditional Q3 peak season, or if demand will remain elevated.
- How quickly the massive influx of newly built container ships will be able to offset the capacity lost to port congestion and longer routes.
- When the geopolitical situation in the Red Sea might stabilize enough to allow a large-scale return to the Suez Canal routing.
How we got here
Late 2023
Security threats force major ocean carriers to divert vessels around the Cape of Good Hope, absorbing roughly 9% of global capacity.
Early 2024
Container freight rates experience their second-highest historical spike as the market adjusts to the new, longer routing geometry.
May 2026
Importers begin aggressively front-loading holiday cargo to hedge against tariff risks and anticipated delays, triggering an unusually early peak season.
June 2026
The sudden surge in demand overwhelms major transshipment hubs in Asia and Europe, causing vessel bunching and severe yard congestion.
July 2026
Global port congestion hits a four-year high, tying up 11% of the world's fleet and driving spot rates to their third-highest peak in history.
- Logistics Providers & Shippers
- Emphasizes the need for proactive inventory management and early booking to navigate unpredictable transit times.
- Maritime Data Analysts
- Focuses on the structural metrics of the shipping network, particularly the hidden inefficiencies masked by adjusted schedules.
- Ocean Carriers
- Prioritizes network stability, capacity management, and the implementation of surcharges to offset operational friction.
Perspectives this story doesn't cover
- Port Terminal Operators
- Retail Consumers
Sources
Source coverage
6 outlets
3 viewpoints surfaced






- [1]The LoadstarMaritime Data Analysts
Rate rises loom as port congestion hits four-year high
Read on The Loadstar → - [2]CLECATLogistics Providers & Shippers
GLOBAL PORT CONGESTION REACHES HIGHEST LEVEL IN FOUR YEARS
- [3]Everstream AnalyticsMaritime Data Analysts
Global Port Congestion Returns As Vessel Delays Build
- [4]Scan Global LogisticsLogistics Providers & Shippers
Summer freight rate surge catches the market off guard
- [5]Global Trade MagazineOcean Carriers
Container Spot Rates Rise Again as Early Peak Season Drives Shipping Demand
Read on Global Trade Magazine → - [6]Maritime GatewayMaritime Data Analysts
Red Sea Diversions and 2026 Shipping Outlook
Read on Maritime Gateway →

More in Transportation
See all →Marine Engineering
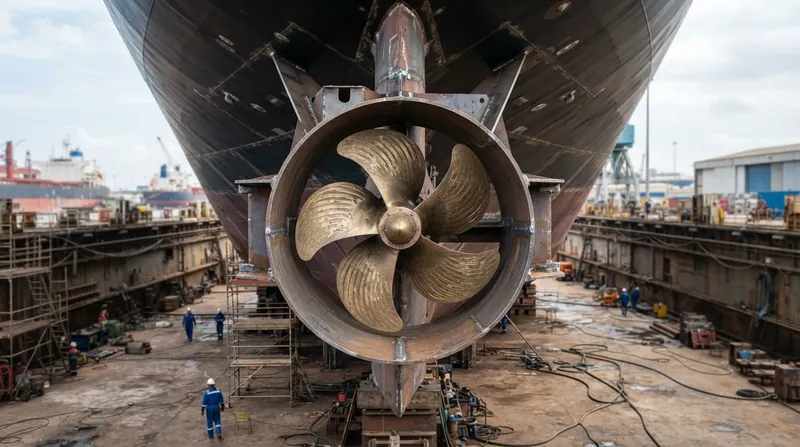
Skewed Blades and Kort Nozzles Quench Cavitation Pulses to Protect Ship Hulls
8 sources
Maritime Physics
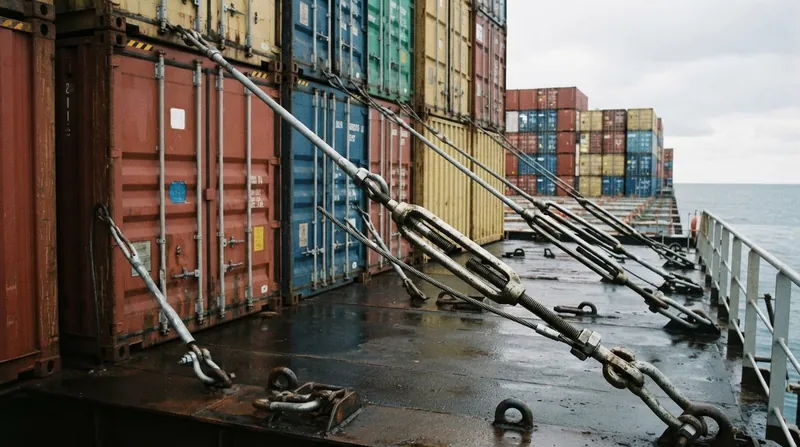
How Twistlocks and Lashing Rods Prevent Container Stacks From Collapsing During Parametric Rolling
6 sources
Cargo Liquefaction
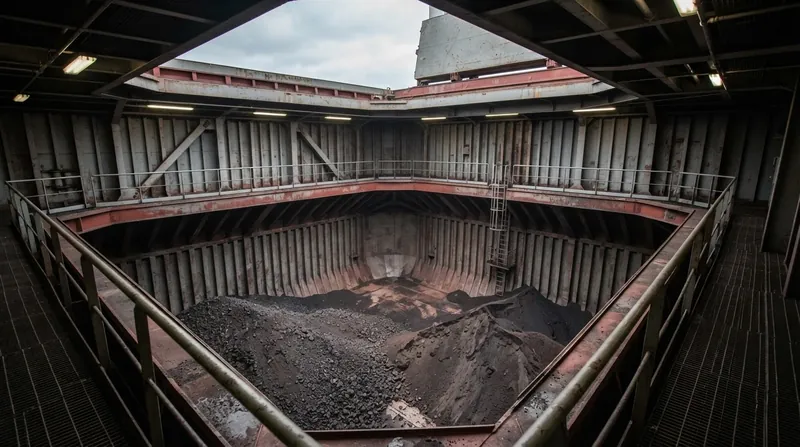
Cyclic Hull Compaction Spikes Pore Water Pressure to Liquefy Solid Ore Cargoes and Capsize Bulk Carriers
6 sources
Naval Blockade
US Fighter Jet Disables Panama-Flagged Cargo Ship in Gulf of Oman Amid Blockade
5 sources

Comments
Every angle. Every day.
Get Transportation stories with full source coverage and perspective breakdowns, free every day.