
The NISP and MNI Metrics: How Bone Fragment Counts and Minimum Individuals Reconstruct Ancient Diet and Economy
Zooarchaeologists rely on two competing mathematical models—the Number of Identified Specimens (NISP) and the Minimum Number of Individuals (MNI)—to translate shattered bone fragments into accurate reconstructions of ancient human diets.

- NISP Advocates
- Argue that NISP is the only additive metric and avoids the aggregation problems of MNI.
- MNI Advocates
- Argue that MNI prevents the severe over-representation of highly fragmented taxa, offering a safer baseline for diet.
- Dual-Metric Analysts
- Argue that both metrics must be used in tandem alongside taphonomic data to bracket the true population size.
Perspectives this story doesn't cover
- Indigenous communities whose ancestral diets are being mathematically reconstructed.
- Modern ecologists comparing ancient faunal baselines to current wildlife populations.
Key points
- NISP (Number of Identified Specimens) counts every identified bone fragment, making it an additive but easily inflated metric.
- MNI (Minimum Number of Individuals) counts the most abundant paired skeletal element, providing a conservative floor for population size.
- Bone fragmentation drives the two metrics apart, with NISP inflating and MNI underestimating the true number of animals.
- Modern zooarchaeologists use both metrics in tandem to bracket the true economic and dietary patterns of ancient populations.
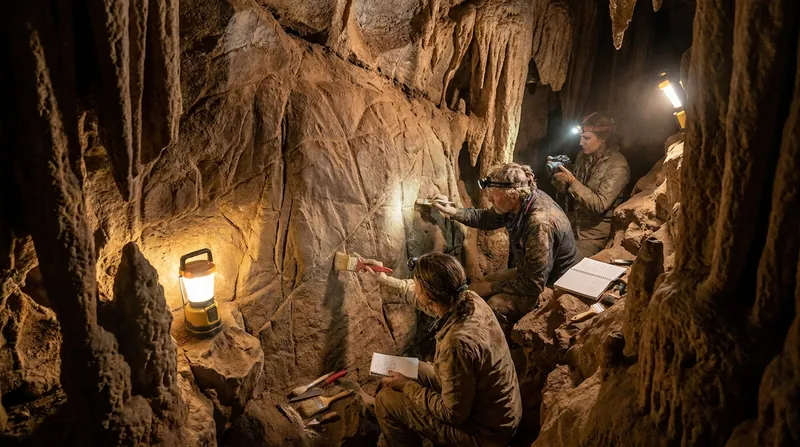
When a modern ecologist counts a herd, they count whole animals. When a zooarchaeologist reconstructs an ancient herd from a refuse pit, they count shattered fragments—and the difference between those two realities forces a choice between two imperfect mathematical models. The Number of Identified Specimens (NISP) and the Minimum Number of Individuals (MNI) are the two foundational metrics used to quantify animal bones at archaeological sites.[1][6]
The distinction between the two dictates how researchers interpret ancient human diets, hunting strategies, and economies. If a site yields 1,000 pig bones and 100 deer bones, the immediate assumption is that pork dominated the diet. But if those 1,000 pig bones are highly splintered fragments from just three animals, and the 100 deer bones are intact elements from ten animals, the economic picture flips entirely.[2][3]
NISP is the older and more fundamental of the two approaches. As defined in standard practice, it counts the number of skeletal elements identified by bone type and taxon. If a researcher identifies 50 horse bones and 200 sheep bones in a trench, the NISP is 50 and 200, respectively. It is an additive, straightforward metric that requires no complex assumptions about how the bones were deposited.[1][6]
However, NISP suffers from a severe vulnerability: fragmentation. A single cow skeleton contains roughly 200 bones. If butchery practices, marrow extraction, or post-depositional trampling shatters those bones into 2,000 identifiable pieces, the NISP inflates by a factor of ten.[1][4]
Consequently, taxa that are heavily processed or have fragile skeletons can appear artificially dominant in the archaeological record. A 2015 analysis of Ertebølle deer exploitation in Denmark demonstrated how fragmentation moves NISP in two directions: increasing it at low levels of breakage, but decreasing it at extreme levels when fragments become too small to identify.[4][6]
To correct for this inflation, researchers developed MNI. Instead of counting every fragment, MNI calculates the absolute smallest number of animals required to account for the assemblage. The zooarchaeologist sorts the bones by skeletal element and side.[2][5]
Instead of counting every fragment, MNI calculates the absolute smallest number of animals required to account for the assemblage.
The math is strictly conservative. If a pit contains five right femurs, three left femurs, and twelve ribs of a deer, the MNI is five. Even though there are 20 total fragments, it takes at least five deer to produce five right femurs. As one educational primer explains, MNI counts the fewest animals possible to explain the bones.[2][6]
While MNI solves the fragmentation inflation problem, it introduces its own mathematical distortions. MNI is highly sensitive to how an assemblage is aggregated. If a site is divided into ten distinct stratigraphic layers, calculating MNI for each layer separately and summing them will produce a much higher total than calculating MNI for the site as a whole.[2][5]
This aggregation problem means MNI values cannot be easily compared across different sites excavated with different methodologies. Furthermore, MNI tends to severely underestimate the actual number of animals present, especially in highly fragmented assemblages.[2][4]
As bone destruction increases, the likelihood of recovering the specific paired elements required to drive up the MNI count drops. In heavily processed assemblages, MNI creates an artificial floor that obscures the true scale of the economic activity.[2][5]
The historical trajectory of zooarchaeology reflects the tension between these two metrics. Early practitioners relied almost exclusively on NISP. In the mid-20th century, the glaring issues with fragmentation led to a widespread adoption of MNI as the superior, more conservative metric.[3][5]
However, modern zooarchaeology has seen a resurgence of NISP, driven by the realization that MNI's statistical flaws—particularly its non-additive nature—make it unsuitable for complex multivariate statistics. Because these foundational papers focus on mathematical modeling rather than field discoveries, no individual researchers are directly quoted in the primary methodological reviews; instead, the debate plays out in statistical formulas. The discipline's methodological shift is often summarized by the question posed in the Journal of Archaeological Science: Why NISP, then MNI, then NISP again?[3][5]
Today, the consensus is that neither metric can stand alone. NISP provides a maximum ceiling of relative abundance, while MNI provides a minimum floor. By plotting both figures against taphonomic indicators—such as bone density, weathering stages, and carnivore gnaw marks—researchers can bracket the true population size and reconstruct a more accurate picture of ancient subsistence.[1][3]
What we don’t know
- The exact original population size, as the true number of animals always sits somewhere in the unquantifiable gap between the MNI floor and the NISP ceiling.
- How much of the original bone assemblage was entirely erased from the archaeological record by scavengers, acidic soil, or weathering before excavation.
- Whether the fragmentation patterns at a given site were caused by human butchery practices or post-depositional trampling.
Sources
Source coverage
7 outlets
3 viewpoints surfaced






- [1]American AntiquityDual-Metric Analysts
NISP vs. MNI in Quantification of Body-Part Representation
Read on American Antiquity → - [2]Archaeological and Anthropological SciencesMNI Advocates
Critical review of the MNI (minimum number of individuals) as a zooarchaeological unit of quantification
Read on Archaeological and Anthropological Sciences → - [3]Journal of Archaeological Science: ReportsNISP Advocates
Observations on the history of zooarchaeological quantitative units: Why NISP, then MNI, then NISP again?
Read on Journal of Archaeological Science: Reports → - [4]American Journal of Archaeology
Zooarchaeology [and] Quantitative Paleozoology
Read on American Journal of Archaeology → - [5]Journal of Archaeological Method and Theory
A Critical Review of Four Efforts to Resurrect MNI in Zooarchaeology
Read on Journal of Archaeological Method and Theory → - [6]Wikipedia
Number of identified specimens - Wikipedia
Read on Wikipedia → - [7]Factlen Editorial TeamDual-Metric Analysts
Synthesis by Factlen editorial team
Read on Factlen Editorial Team →
Comments
More in Science
See all →Operant Conditioning
Fixed Ratio, Variable Ratio, Fixed Interval, and Variable Interval: The Four Schedules of Reinforcement That Dictate Behavior Persistence
7 sources
Organic Catalysts
New Coumarin-Linked Organic Catalyst Extends Solar Charge Lifetime by 1,000 Times for Hydrogen Production
3 sources

Venusian Atmosphere
Venus's Pale Clouds Hide a Substance as Dark as Tar, New Optical Model Shows
4 sources

Dark Matter
The Flat Galactic Rotation Curve: How Missing Mass Explains the Speed of Stars Far From the Galactic Center
6 sources

Every angle. Every day.
Get Science stories with full source coverage and perspective breakdowns delivered to your inbox.