The Buffett Indicator Hits 233%: What the Historic Market-to-GDP Ratio Means for Long-Term Investors
The total value of the U.S. stock market has reached a record 233% of the nation's gross domestic product, surpassing previous peaks. While the milestone triggers historical valuation warnings, financial planners emphasize that modern corporate structures and globalized earnings require a nuanced interpretation of the famous metric.
By Factlen Editorial Team
- Traditional Value Analysts
- Argue that the historic ratio signals extreme overvaluation and warrants defensive portfolio positioning.
- Structural Market Optimists
- Emphasize that globalization and the AI productivity boom justify higher structural valuations than in the past.
- Pragmatic Financial Planners
- View the indicator as a prompt for routine portfolio rebalancing rather than a signal to exit the market.
What's not represented
- · Retail investors who rely heavily on passive index funds and cannot easily rebalance away from mega-cap tech.
- · Corporate executives managing share buyback programs, which reduce share counts and artificially support high market capitalizations.
Why this matters
Understanding market valuation metrics helps investors make rational, long-term decisions rather than reacting emotionally to scary headlines. By contextualizing the Buffett Indicator, everyday investors can better assess their portfolio risk, rebalance effectively, and avoid the wealth-destroying mistake of panic-selling during a bull market.
Key points
- The Buffett Indicator, which compares U.S. stock market capitalization to GDP, has hit a record 233%.
- Warren Buffett historically warned that a ratio approaching 200% means investors are 'playing with fire.'
- Structural changes, including the globalization of U.S. corporate revenue, naturally inflate the modern ratio.
- Financial planners advise using the milestone as a prompt to rebalance portfolios, not to panic-sell.
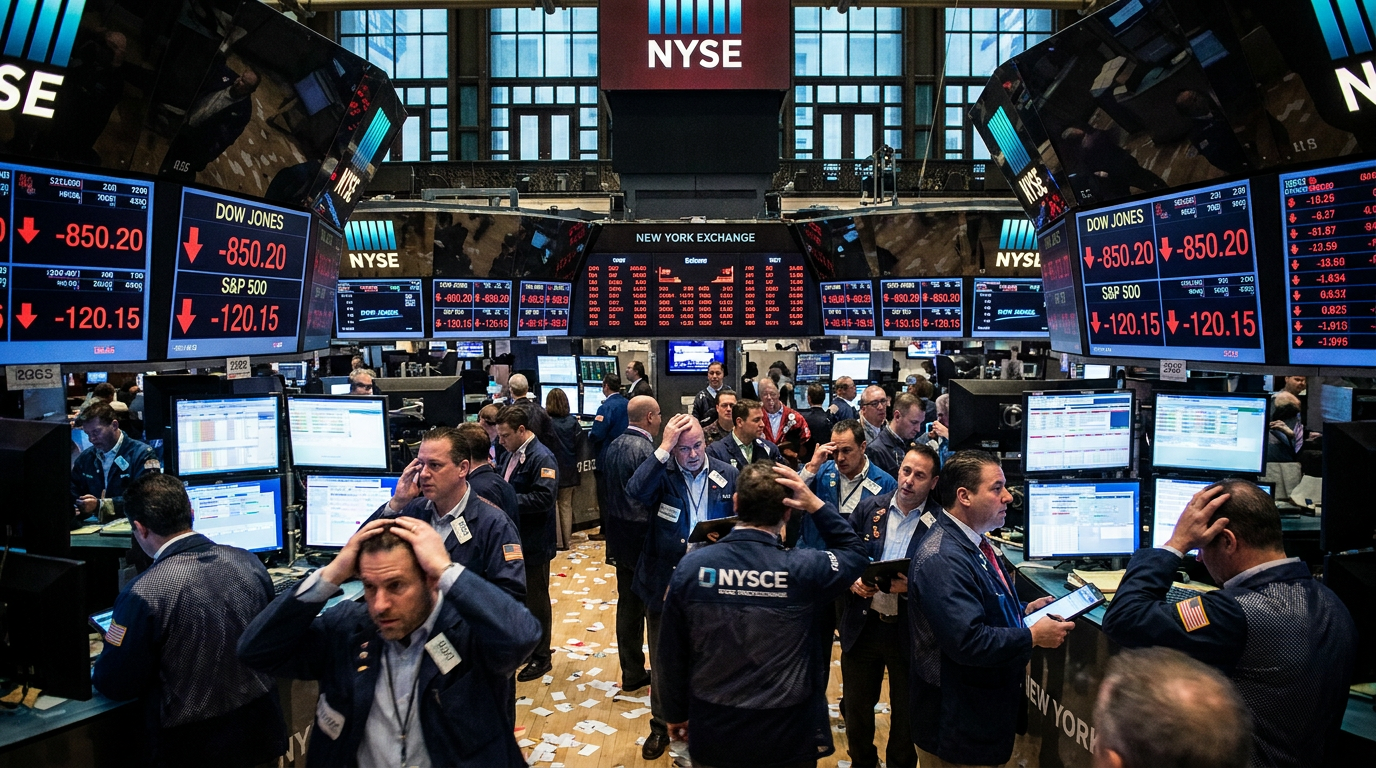
The U.S. stock market has spent much of 2026 breaking records, driven by robust corporate earnings and the ongoing artificial intelligence boom. But alongside the soaring indices, a lesser-known but highly respected financial metric has quietly crossed a historic threshold. The Market Capitalization to GDP ratio—widely known as the "Buffett Indicator"—has surged past 233%, marking an all-time high. For everyday investors, the milestone has sparked a flurry of headlines, largely because of the metric's famous namesake and his historical warnings about market exuberance.[1][2]
The indicator is elegant in its simplicity. It takes the total value of all publicly traded companies in the United States—currently hovering around $76.1 trillion—and divides it by the nation's annualized gross domestic product, which sits at approximately $31.8 trillion. The resulting percentage offers a macroeconomic snapshot of how the stock market's size compares to the underlying real economy. When the market outpaces economic output by a wide margin, the ratio climbs.[3][4]
The metric earned its colloquial name in late 2001, when billionaire investor Warren Buffett co-authored a Fortune magazine essay evaluating the aftermath of the dot-com crash. In the piece, Buffett called the ratio "probably the best single measure of where valuations stand at any given moment." He also offered a rule of thumb that has echoed through financial media ever since: buying stocks when the ratio is near 70% or 80% is likely to work well, but if the ratio approaches 200%, investors are "playing with fire."[5][8]

Today, with the indicator sitting well above that 200% threshold, traditional value analysts are urging caution. The ratio is now significantly higher than it was during the peaks of the 2000 dot-com bubble, the 2007 housing boom, and the 2021 post-pandemic rally. For some market historians, this suggests that equities are priced for perfection, meaning that every dollar of U.S. economic output is currently being valued at more than two dollars in market capitalization.[6][7]
However, financial planners and structural market optimists caution against using the 233% figure as a reason to panic or liquidate portfolios. The modern stock market is fundamentally different from the one Buffett analyzed in 2001, and several structural shifts have naturally pushed the baseline of the indicator higher over the past two decades. Understanding these shifts is crucial for investors trying to make sense of today's valuations.[2][3]
The most significant change is the globalization of American business. The Buffett Indicator compares U.S. market capitalization to U.S. GDP. But today, the companies that make up the S&P 500 generate roughly 41% of their total revenue from overseas markets. A multinational tech giant might sell billions of dollars worth of software in Europe and Asia, which boosts its market capitalization, but those foreign sales do not count toward U.S. GDP. As American companies have become increasingly global, the numerator of the Buffett Indicator has grown much faster than the denominator.[3][5]
The most significant change is the globalization of American business.
Furthermore, the composition of the public markets has shifted heavily toward asset-light, high-margin technology companies. In previous decades, the largest public companies were industrial and manufacturing behemoths that required massive capital investments to grow. Today's market is dominated by software, semiconductor, and digital services companies that can scale globally with relatively low marginal costs. This shift has pushed corporate profits as a share of GDP to near-record highs of 12%, justifying higher overall market valuations.[6][8]

The concentration of the "Magnificent Seven" tech stocks also skews the broader market picture. Because the Buffett Indicator looks at the aggregate market, the astronomical valuations of a handful of artificial intelligence and cloud computing leaders pull the entire ratio upward. When analysts look at the equal-weighted market—where the smallest company has the same influence as the largest—valuations appear much closer to historical norms.[5][8]
Interest rates and monetary policy play another critical role in contextualizing the metric. While the Federal Reserve has maintained higher interest rates in recent years to combat inflation, the overall supply of money and liquidity in the global financial system remains vast compared to the late 1990s. Some financial models have even adapted the traditional Buffett Indicator to include the Federal Reserve's balance sheet in the denominator, which brings the current valuation ratio down to a less extreme, though still elevated, 194%.[1][4]
For everyday investors, the most important takeaway is that the Buffett Indicator is a measure of long-term valuation, not a short-term timing tool. Historically, high valuations suggest that forward returns over the next decade might be more muted compared to the explosive growth of the past five years. It does not, however, predict imminent crashes. Markets can remain overvalued for years, and exiting the market entirely often results in missing out on substantial compounding gains.[2][7]
Instead of viewing the 233% milestone as a sell signal, pragmatic financial planners use it as a prompt for disciplined portfolio maintenance. When U.S. equities become highly valued, it is an opportune time for investors to rebalance their accounts. If a prolonged bull market has pushed a portfolio's stock allocation from a target of 70% up to 85%, selling the excess to buy fixed-income assets or international equities locks in gains and restores the intended risk profile.[6][7]

Diversification also becomes increasingly valuable in a high-valuation environment. With U.S. large-cap stocks driving the Buffett Indicator to record highs, advisors are pointing clients toward areas of the market that remain relatively inexpensive. Small-cap stocks, value-oriented dividend payers, and international equities currently trade at much lower multiples than the headline U.S. indices, offering potential safe havens if mega-cap tech valuations eventually normalize.[5][6]
Ultimately, the Buffett Indicator remains a vital gauge of market temperature, reminding investors that trees do not grow to the sky. While the "playing with fire" threshold has been crossed, the modern financial landscape requires a nuanced reading of the data. By maintaining a diversified portfolio, adhering to a long-term strategy, and ignoring the impulse to time the market, investors can navigate historic valuations with confidence rather than anxiety.[2][8]
How we got here
December 2001
Warren Buffett popularizes the Market Cap to GDP ratio in a Fortune magazine essay, calling it the best single measure of valuations.
February 2021
The indicator crosses the 200% threshold for the first time during the post-pandemic technology and stimulus rally.
October 2025
The ratio surges past 220%, driven by the heavy concentration of mega-cap technology stocks and artificial intelligence investments.
June 2026
The Buffett Indicator reaches an all-time high of 233%, prompting renewed debate over structural market shifts versus overvaluation.
Viewpoints in depth
Traditional Value Analysts
Argue that the historic ratio signals extreme overvaluation and warrants defensive portfolio positioning.
This camp points to the mathematical reality that market capitalization cannot outpace economic output indefinitely. They argue that the current 233% ratio—well above the 200% threshold Warren Buffett famously warned about—indicates that equities are priced for absolute perfection. From this perspective, even if a crash is not imminent, the sheer mathematical weight of current valuations guarantees that forward returns over the next decade will be significantly lower than historical averages, making cash and fixed-income assets more attractive.
Structural Market Optimists
Emphasize that globalization and the AI productivity boom justify higher structural valuations than in the past.
Optimists argue that the Buffett Indicator is fundamentally flawed in a modern, globalized economy. Because U.S. companies now generate over 40% of their revenue overseas, the market capitalization numerator grows from global sales, while the GDP denominator remains strictly domestic. Furthermore, they highlight that today's market is dominated by asset-light, high-margin technology companies rather than capital-intensive industrials. These structural shifts, combined with record corporate profit margins, mean that a 233% ratio today does not carry the same systemic risk as it would have in 2001.
Pragmatic Financial Planners
View the indicator as a prompt for routine portfolio rebalancing rather than a signal to exit the market.
For everyday advisors, macroeconomic indicators are tools for risk management, not market timing. This camp acknowledges that valuations are stretched but warns that selling out of the market entirely is a proven wealth-destroyer. Instead, they use the 233% milestone as a behavioral trigger to enforce discipline: rebalancing portfolios back to their target asset allocations, taking some profits from high-flying U.S. large-cap stocks, and reallocating capital to relatively cheaper international equities or small-cap value stocks.
What we don't know
- How much of the current valuation premium is a permanent structural shift due to AI productivity gains versus a temporary cyclical peak.
- Whether the eventual normalization of the ratio will occur through a market correction or through a period of rapid GDP growth catching up to equity prices.
Key terms
- Market Capitalization
- The total dollar value of all outstanding shares of a publicly traded company, or in this case, the entire stock market.
- Gross Domestic Product (GDP)
- The total monetary value of all finished goods and services produced within a country's borders in a specific time period.
- Wilshire 5000 Index
- A broad market-capitalization-weighted index that tracks the performance of virtually all actively traded U.S. stocks.
- Asset Allocation
- An investment strategy that aims to balance risk and reward by apportioning a portfolio's assets according to an individual's goals, risk tolerance, and investment horizon.
Frequently asked
What exactly is the Buffett Indicator?
The Buffett Indicator is a valuation metric that divides the total value of all publicly traded U.S. companies by the annualized U.S. Gross Domestic Product (GDP).
Why did Warren Buffett say it is 'playing with fire'?
In a 2001 essay, Buffett noted that when the ratio of market capitalization to GDP approaches 200%, the stock market is heavily overvalued relative to the actual economic output, increasing the risk of poor future returns.
Does a high Buffett Indicator mean the market will crash?
No. The indicator is a measure of long-term valuation, not a short-term timing tool. Markets can remain highly valued for years, and exiting entirely often causes investors to miss out on compounding gains.
How does globalization affect this metric?
U.S. companies now earn roughly 41% of their revenue overseas. These global sales boost their market capitalization, but they do not count toward U.S. GDP, which naturally pushes the ratio higher than it was in previous decades.
Sources
Source coverage
8 outlets
3 viewpoints surfaced


[1]GuruFocusPragmatic Financial Planners
Market Valuations and the Buffett Indicator
Read on GuruFocus →[2]Advisor PerspectivesStructural Market Optimists
Buffett Indicator: The Latest Data
Read on Advisor Perspectives →[3]Current Market ValuationStructural Market Optimists
The Buffett Indicator at All-Time Highs
Read on Current Market Valuation →[4]MacroMicro
US - Market Cap (% of GDP)
Read on MacroMicro →[5]Briefing.comTraditional Value Analysts
Is the stock market due for a correction?
Read on Briefing.com →[6]Bloomberg IntelligenceTraditional Value Analysts
Buffett Indicator at all-time high, signaling equity excesses
Read on Bloomberg Intelligence →[7]PluangPragmatic Financial Planners
Warren Buffett indicator hits record 236%, signaling historically high U.S. stock valuations
Read on Pluang →[8]BigGoTraditional Value Analysts
Buffett Indicator Surges Past 227% to Historic Extreme
Read on BigGo →


Every angle. Every day.
Get finance stories with full source coverage and perspective breakdowns delivered to your inbox.