
Data & Analysis
Follow Data & Analysis in the Factlen app and get an alert when there is news. Get the app


Explainer
Dichotomizing Continuous Predictors Discards 36 Percent of Information: Why Median Splits Distort Estimates
10 sources · 19d ago

Explainer
Kaplan-Meier Survival Models Overestimate Clinical Risk by Ignoring Competing Deaths
6 sources · 19d ago

Ecosystem Restoration
Neglecting Degraded Land Costs Up to $6.3 Trillion Yearly, UN Forest Assessment Warns
5 sources · 19d ago
More in Data & Analysis

Cancer ResearchWorld Health Organization
WHO Analysis Finds Preventable Infections Cause One in Eight Cancer Cases Worldwide
Public Health Officials 40%Oncology Researchers 35%Global Health Equity Advocates 25%

Energy TransitionIRENA
IRENA Models $256 Trillion Energy Transition Pathway to Reverse Global 1.5C Overshoot
Renewable Energy Advocates 35%Grid Infrastructure Planners 35%Energy Transition Analysts 30%
ExplainerStatistical Methods
How Standardization Transforms Raw Data into Z-Scores for Global Indices
Statistical Methodologists 40%Institutional Indexers 40%Critical Analysts 20%

Attribution ScienceStudy Findings
Study Quantifies Long-Term Warming Impact of Top 178 Fossil Fuel Producers' Past Emissions
Scientific Consensus 45%Climate Accountability Advocates 35%Industry & Economic Context 20%

Macroeconomic OutlookForecast Divergence
Global Economic Forecasts Diverge for 2026 as AI and Emerging Markets Drive Growth
Technology Optimists 40%Monetary Realists 40%Emerging Market Bulls 20%

Global HealthImpact Projection
Global Aid Cuts Projected to Cause 22 Million Preventable Deaths by 2030
Global Health Researchers 40%Humanitarian Organizations 35%Donor Nation Policymakers 25%

Workforce ShiftTrend Analysis
41-Country Study Finds AI Adoption Increases Senior Workforce 6.7% While Junior Employment Falls 3%
Labor Economists 40%Corporate Executives 35%Early-Career Advocates 25%

Survival ModelingClinical Trial Results
Mixture Cure Model Projects 87% of Myeloma Patients on Tec-Dara May Achieve Normal Life Expectancy
Clinical Researchers 60%Industry Analysts 40%

WEF OutlookTrend Analysis
WEF Chief Economists Survey Projects Global Economic Stabilization Amid Regional Divergence and AI Pressures
Macroeconomic Optimists 40%Resource & Infrastructure Realists 35%Developing Economy Advocates 25%

Global Health DemographicsData Release
Global Burden of Disease 2023 Analyses Map Shifting Mortality and NCD Trends Across Africa and ASEAN
Epidemiological Modellers 40%Local Public Health Authorities 30%Global Health Policy Advocates 30%

Macroeconomic ForecastTrend Analysis
Global Economic Growth Upgraded to 2.9% as AI Investment Offsets Energy Shocks
Macroeconomic Optimists 40%Inflation Hawks 40%Trade Risk Analysts 20%

Climate ModelingMethodology Update
New Climate Model Incorporating Earth's Energy Imbalance Projects 25% Higher Global Warming
Methodological Researchers 60%Regional Impact Analysts 40%

ExplainerStatistical Methods
The P-Value is the Probability of Observing Data as Extreme as the Current Data, Assuming the Null Hypothesis is True
Frequentist Traditionalists 35%Bayesian Reformers 35%Pragmatic Methodologists 30%

ExplainerEvaluation Metrics
AUC-ROC Equals the Probability of Ranking a Positive Example Over a Negative One
Algorithmic Evaluators 40%Statistical Theorists 30%Applied Data Scientists 30%
ExplainerRegression Mechanics
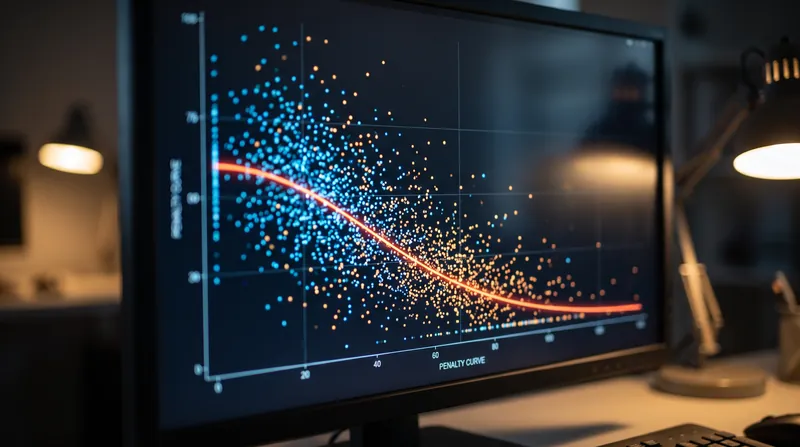
How Adjusted R-Squared Penalizes the Addition of Irrelevant Predictors to Prevent Model Overfitting
Classical Statistics 60%Predictive Modeling 40%

Research BriefForecast Math
Why the Hurricane Cone of Uncertainty Scales with the Square Root of Time
Meteorological Forecasters 40%Financial Quants 35%Supply Chain Analysts 25%
ExplainerRegression Diagnostics
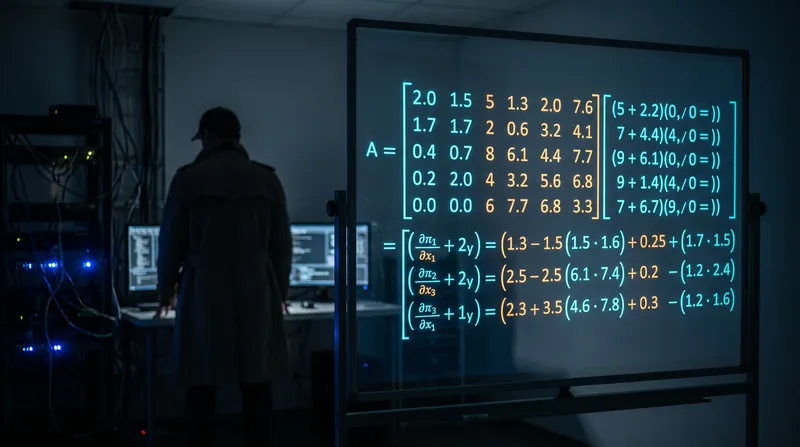
How a Near-Zero Eigenvalue in the Design Matrix Reveals Multicollinearity in Regression
Causal Inference Researchers 40%Predictive Modelers 35%Regularization Advocates 25%
ExplainerContingency Tables
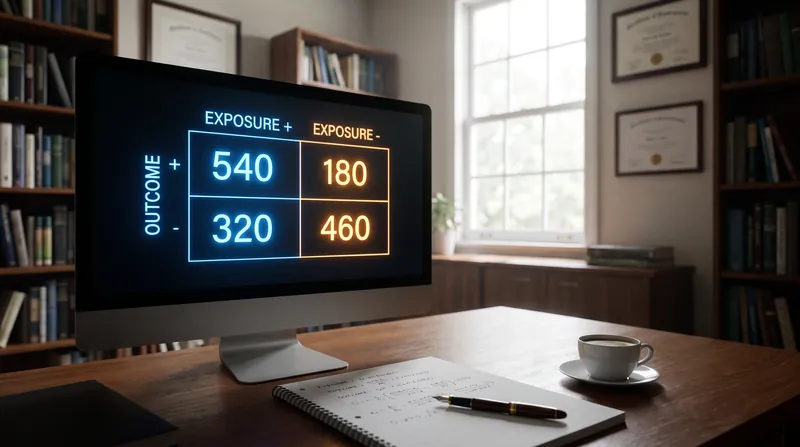
Why Contingency Tables Multiply Marginal Totals to Find Expected Frequencies
Frequentist Statisticians 40%Data Scientists 30%Quality Control Engineers 30%
Inflation WatchEconomic Sentiment
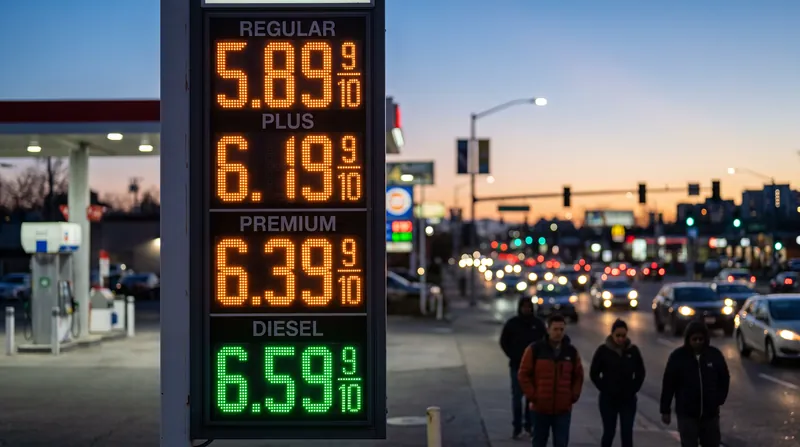
U.S. Consumer Inflation Expectations Jump to 4.6% in Preliminary September Data
Monetary Policy Analysts 40%Consumer Behavior Researchers 35%Market Forecasters 25%

ExplainerCausal Inference
The Unconfoundedness Assumption: How the Probability of Treatment Assignment Must Be Independent of Potential Outcomes Given Observed Covariates
Causal Methodologists 40%Social Scientists 30%Epidemiologists 30%

ExplainerRegression Math
The Five Assumptions That Guarantee Ordinary Least Squares is the Best Linear Unbiased Estimator
Classical Statisticians 50%Applied Econometricians 50%

Florida SenatePolling Shift
Florida Senate Polls Show Dead Heat Between Incumbent Ashley Moody and Challenger Angie Nixon
Progressive Challengers 35%Incumbent Republicans 35%Electoral Analysts 30%

ExplainerData Visualization
Edward Tufte's Lie Factor Quantifies Chart Distortion by Comparing Graphic and Data Changes
Data Integrity Advocates 40%Visual Designers 30%Cognitive Researchers 30%

ExplainerTime Series
Tuning Alpha, Beta, and Gamma to Balance Memory in Holt-Winters Forecasting
Historical Stability Proponents 45%High Responsiveness Advocates 35%Automated Optimization Proponents 20%
ExplainerStatistical Methods
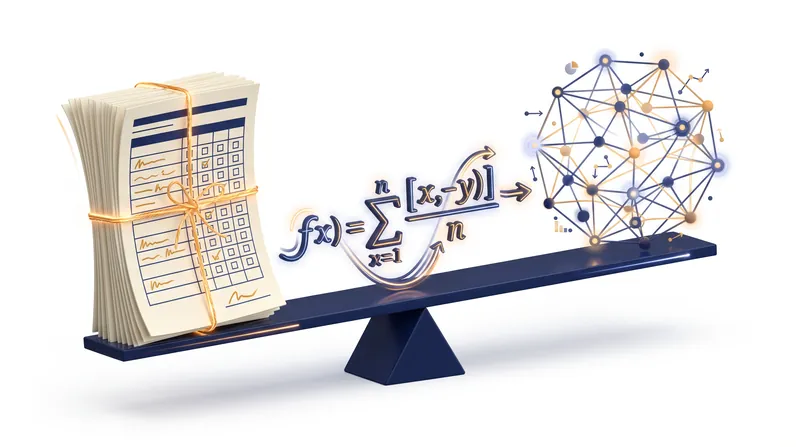
How Cronbach's Alpha is a Function of Both the Number of Items and the Average Inter-Item Correlation
Psychometric Theorists 40%Applied Data Analysts 40%Statistical Reformers 20%

Innovation RankingsPolicy Benchmark
WIPO Global Innovation Index 2026 Ranks 140 Economies, Highlights Deep Science Entrepreneurship
Global IP Administrators 40%Regional Economic Planners 40%Methodology Analysts 20%

ExplainerMacroeconomic Modeling
Setting Lambda in the Hodrick-Prescott Filter to Balance Fit and Smoothness
Traditional Macroeconomists 40%Time-Series Skeptics 40%Software Implementers 20%

ExplainerStatistical Modeling
Calculating the F-Statistic by Dividing Explained Variance by Residual Noise
Classical Inference 40%Predictive Modeling 35%Process Control 25%
ExplainerStatistical Theory
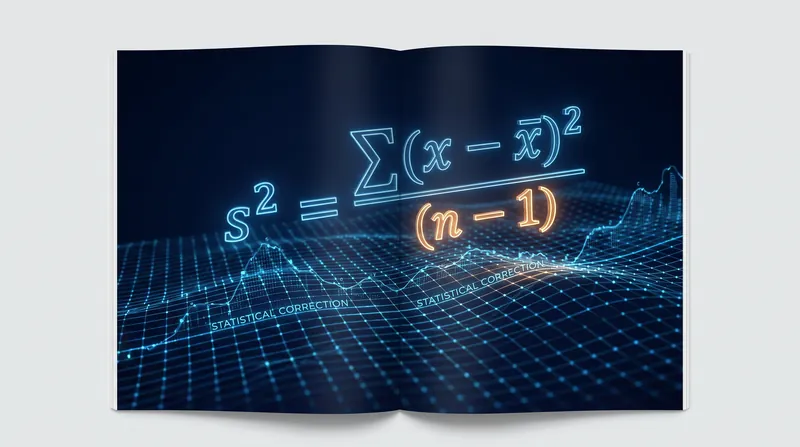
How Estimating a Parameter Consumes One Degree of Freedom to Ensure Unbiased Variance
Theoretical Statisticians 45%Applied Data Scientists 35%Pedagogical Instructors 20%

ExplainerStatistical Modeling
The Bayes Factor: How the Ratio of Marginal Likelihoods Quantifies Evidence for Competing Hypotheses
Objective Bayesians 45%Subjective Bayesians 30%Frequentist Defenders 25%
ExplainerStatistical Modeling
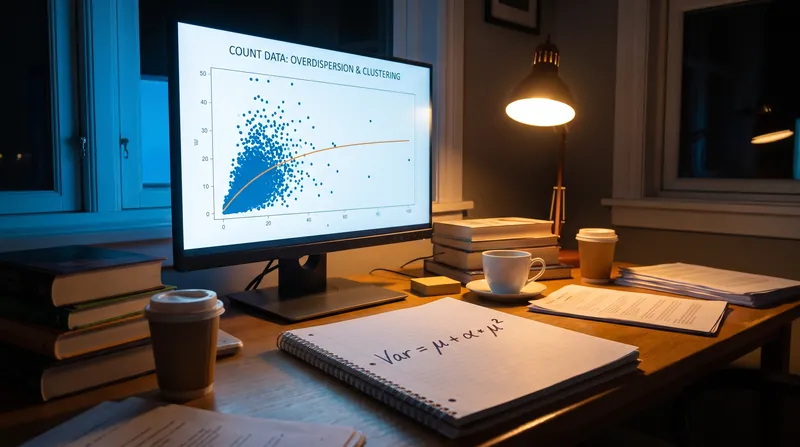
Negative Binomial Regression Adds Dispersion Parameters to Correct Poisson Standard Errors
Classical Frequentists 40%Applied Epidemiologists 40%Computational Statisticians 20%

ExplainerData Visualization
The Square Root Transformation: Why Bubble Chart Radii Must Scale to the Square Root of the Data Value
Mathematical Purists 60%Pragmatic Developers 20%Psychophysical Researchers 20%

ExplainerForecast Metrics
Why Mean Absolute Percentage Error (MAPE) is Biased and How SMAPE Attempts to Correct It
Statistical Methodologists 60%Forecasting Practitioners 40%
ExplainerRegression Diagnostics
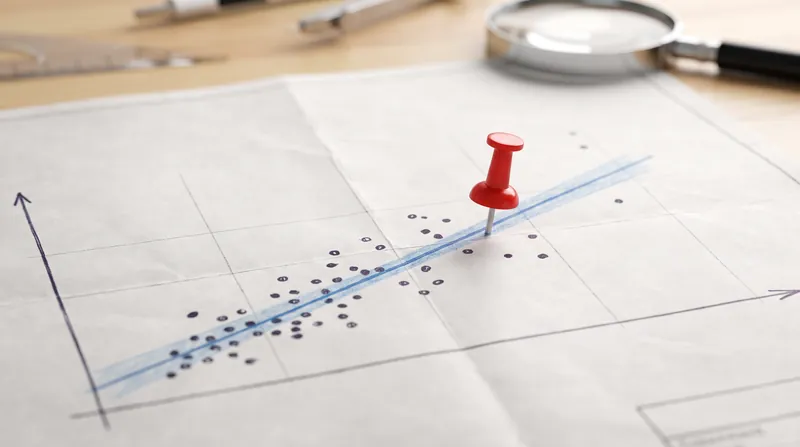
How Cook's Distance Quantifies the Change in Regression Coefficients When a Single Observation is Removed
Dynamic Scaling 60%Conservative Diagnostics 40%
ExplainerLoss Functions
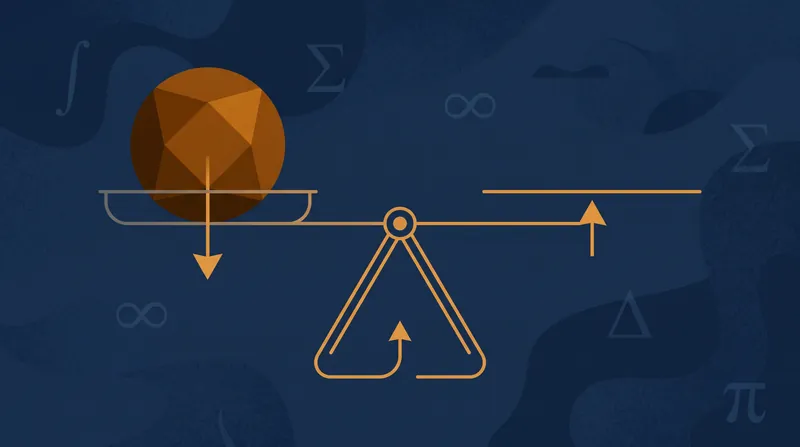
The Mathematical Trade-Off Between the Mean and the Median in Loss Function Optimization
Classical Optimization Theorists 55%Robust Statistics Advocates 45%

Research BriefClinical Trial Design
How Intention-to-Treat Analysis Preserves Randomization and Prevents Selection Bias
Methodologists & Regulators 45%Clinical Practitioners 30%Biomedical Researchers 25%

ExplainerStatistical Modeling
EM Algorithm Resolves Missing Data by Alternating Estimation and Parameter Optimization
Theoretical Statisticians 40%Applied Data Scientists 40%Machine Learning Researchers 20%

ExplainerTime Series Analysis
Exponential Smoothing's Alpha Parameter Balances Responsiveness and Historical Stability
Algorithmic Optimizers 40%Domain Experts 35%Robustness Advocates 25%

ExplainerModel Evaluation
How K-Fold Cross-Validation Balances Bias and Variance to Estimate a Model's Generalization Error
Applied Practitioners 45%Statistical Theorists 35%Deep Learning Researchers 20%

ExplainerData Visualization
Why Line Chart Aspect Ratios Distort Volatility and How Banking to 45 Degrees Works
Mathematical Optimization Purists 40%Responsive Design Advocates 35%Alternative Visualization Proponents 25%

Research BriefYield Curve
Evidence Pack: The Accuracy of the Yield Curve Inversion as a Recession Forecaster in the Era of Quantitative Easing
Structural Adjustment Theorists 40%Traditional Forecasters 30%Macroeconomic Pragmatists 30%

Feature SelectionMethod Comparison
Why Lasso's L1 Diamond Geometry Forces Coefficients to Zero for Feature Selection
Sparsity Advocates 40%Stability Advocates 35%Hybrid Practitioners 25%

ExplainerConstitutional Law
The U.S. Constitution Is the Second-Hardest to Amend in the Democratic World
Comparative Political Scientists 40%Democratic Reformers 35%Constitutional Originalists 25%

ExplainerStatistical Theory
Why a 95% Confidence Interval Does Not Mean a 95% Chance the True Mean is Within the Range
Frequentist Traditionalists 40%Bayesian Reformers 35%Applied Practitioners 25%

Research BriefAgricultural Yields
The Data on Organic vs. Conventional Farming: Why Environmental Impacts Depend on How You Measure Them
Yield-Maximization Proponents 38%Agroecological Advocates 31%Dietary Shift Advocates 31%

ExplainerData Geometry
The Geometric Flaw of Radar Charts: How Axis Ordering Distorts Area and Misleads Multi-Metric Comparisons
Data Visualization Researchers 65%Business Intelligence Practitioners 35%
Per page