
Data & Analysis
Follow Data & Analysis in the Factlen app and get an alert when there is news. Get the app

Explainer
How Granger Causality Tests for Predictive Precedence, Not True Causal Influence
6 sources · 39d ago
Explainer
Evidence Pack: The Accuracy and Trade-Offs of SMOTE Versus Class Weights in Imbalanced Data
6 sources · 39d ago

Explainer
Evidence Pack: How Bagging Reduces Variance While Boosting Reduces Bias in Ensemble Models
7 sources · 39d ago
More in Data & Analysis

ExplainerCausal Inference
Evidence Pack: The Accuracy and Limits of Propensity Score Matching in Observational Research
Methodological Critics 40%Applied Researchers 30%Causal Inference Theorists 30%

ExplainerDifferential Privacy
Evidence Pack: The Accuracy and Utility Trade-Offs of Differential Privacy
Cryptographic Privacy Advocates 35%Empirical Researchers 35%Commercial Implementers 30%

ExplainerData Visualization
Sankey Diagrams Use Proportional Link Widths to Track Mass and Energy Conservation
Energy & Sustainability Analysts 40%Data Visualization Practitioners 30%Clinical Researchers 30%

ExplainerCausal Inference
Why Difference-in-Differences Studies Must Bound Parallel Trends Uncertainty
Methodological Reformers 45%Classical Practitioners 35%Causal Inference Skeptics 20%

ExplainerAlgorithmic Ranking
Why the Elo Rating System Uses a Logistic Curve to Prevent Rating Deflation
Simplicity Advocates 40%Bayesian Statisticians 40%Classical Purists 20%
ExplainerMeta-Analysis
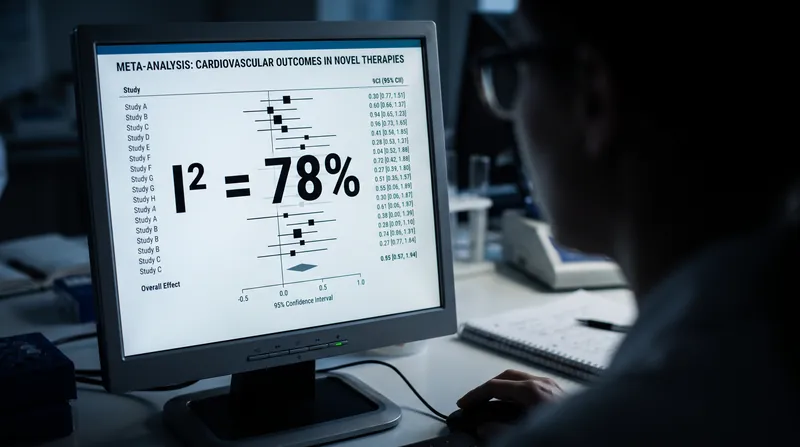
Why High Study Precision Artificially Inflates Meta-Analysis I² Scores
Methodological Purists 40%Pragmatic Reviewers 35%Clinical Consumers 25%

Sequential Testing
Alpha-Spending Functions Ration Error Budgets to Prevent False Positives in A/B Tests
Frequentist Statisticians 40%Bayesian Practitioners 30%Product and Growth Teams 30%

Dimensionality Reduction
Covariance Matrix Eigenvectors Define Directions of Maximum Variance in PCA
Geometric Interpreters 35%Algebraic Purists 35%Applied Data Scientists 30%

ExplainerStatistical Methodology
How Standard Error Compresses Apparent Variance Compared to Standard Deviation
Descriptive Analysts 40%Inferential Modelers 40%Scientific Communicators 20%

ExplainerStatistical Inference
Why Prediction Intervals Never Shrink to Zero While Confidence Intervals Do
Forecasting Practitioners 40%Clinical Researchers 35%Machine Learning Engineers 25%

ExplainerTime-Series AI
Zero-Shot Time-Series Foundation Models Now Match or Outperform Custom Algorithms
Foundation Model Developers 60%Quantitative Finance Skeptics 40%

ExplainerSurvey Methodology
Evidence Pack: The Accuracy of Address-Based Sampling Versus Random Digit Dialing in Election Polling
Survey Methodologists 40%Data Quality Skeptics 30%Commercial Pollsters 30%

ExplainerRank Correlation
Spearman's Rho vs. Kendall's Tau: The Mathematical Trade-offs in Rank Correlation
Robust Statistics Advocates 45%Computational Efficiency Proponents 35%Applied Data Analysts 20%

Research BriefDemographic Proxies
Evidence Pack: The Accuracy of BISG and Algorithmic Demographic Imputation
Regulatory Agencies 40%Data Scientists & AI Researchers 35%Civil Rights Advocates 25%

AI PanelsAccuracy Benchmark
Evidence Pack: The Accuracy of Synthetic Data in Replicating Human Survey Responses
Survey Methodologists 45%Market Research Buyers 35%AI Panel Vendors 20%

ExplainerAnomaly Detection
Evidence Pack: The Accuracy of Benford's Law in Detecting Financial and Electoral Fraud
Forensic Accountants 40%Political Scientists 40%Data Visualisation Analysts 20%

ExplainerBayesian Inference
Metropolis-Hastings Cancels Impossible Denominators to Sample Posterior Distributions
Bayesian Statisticians 40%Computational Scientists 35%Machine Learning Engineers 25%
Research BriefData Visualization
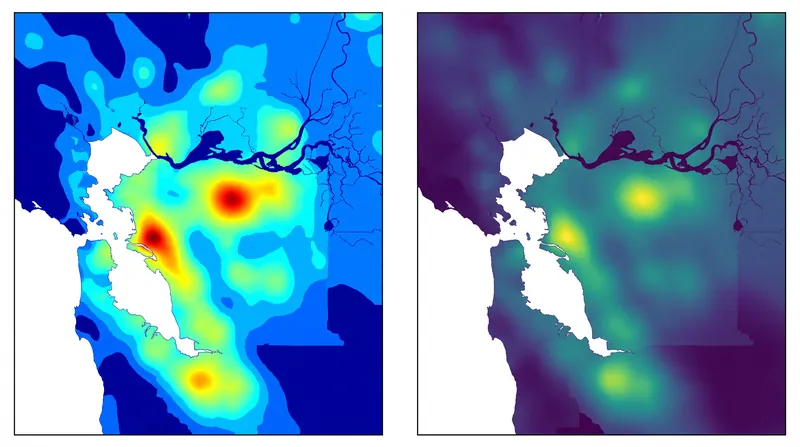
The 7.5% Visual Distortion Penalty of the Rainbow Colormap
Visualization Researchers 40%Accessibility Advocates 35%Applied Scientists 25%

Research BriefSeismology AI
The Accuracy of Deep Learning Versus ETAS in Earthquake Aftershock Forecasting
Statistical Seismologists 35%Machine Learning Researchers 35%Operational Forecasters 30%

ExplainerInequality Metrics
Measuring the Wealth Gap: How the Lorenz Curve's Geometry Calculates the Gini Coefficient
Macroeconomic Standard 40%Statistical Methodology 40%Editorial Synthesis 20%

ExplainerSurvey Methodology
How Iterative Proportional Fitting Forces Survey Samples to Match Population Margins
Commercial Pollsters 40%Survey Methodologists 35%Algorithmic Researchers 25%
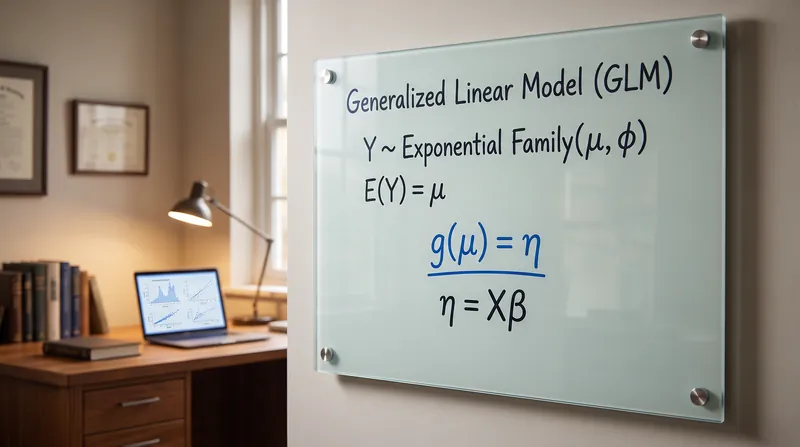
ExplainerStatistical Modeling
Link Functions: Translating Bounded Outcomes Into Unbounded Linear Predictors
Statistical Purists 40%Applied Data Scientists 40%Software Developers 20%

Research BriefVisual Data Analysis
How 100 Million Children's Drawings Reveal Two Decades of Cultural Trends
Data Analysts 50%Educators and Sociologists 50%

ExplainerAlgorithmic Transparency
How SHAP Values Decompose a Black-Box Model's Prediction into Feature Contributions
Algorithmic Transparency Advocates 35%Causal Inference Skeptics 35%Applied Data Scientists 30%

Research BriefAlgorithm Selection
Evidence Pack: Tree-Based Models Versus Deep Learning for Tabular Data
Gradient Boosting Proponents 45%Deep Learning Optimists 35%Pragmatic Ensemblers 20%
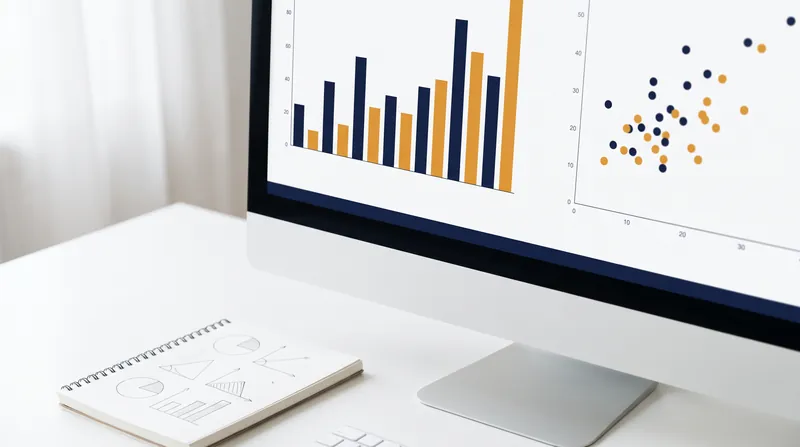
ExplainerGraphical Perception
Why the Cleveland-McGill Hierarchy Ranks Position Over Area and Color
Statistical Purists 35%Human-Computer Interaction Researchers 35%Data Visualization Practitioners 30%

Research BriefWastewater Epidemiology
Evidence Pack: The Accuracy of Wastewater Surveillance in Forecasting Regional Viral Outbreaks
Epidemiological Modelers 40%Public Health Officials 35%Municipal Utility Operators 25%
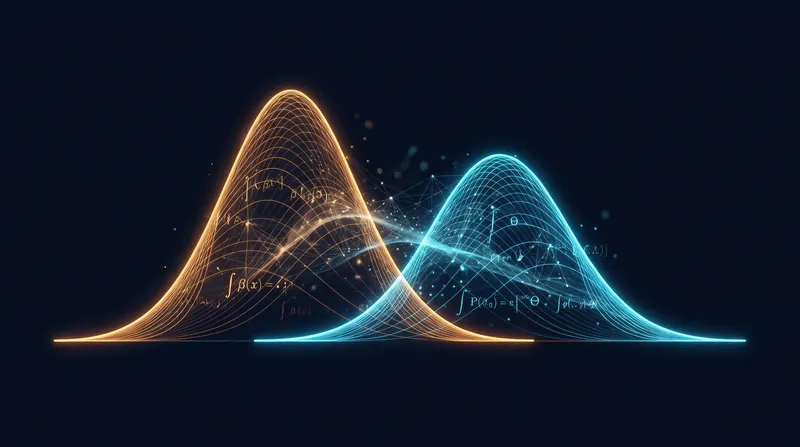
ExplainerBayesian Inference
Beta-Binomial Conjugate Pairs Prevent Small-Sample Errors Through Simple Addition
Bayesian Practitioners 60%Frequentist Analysts 40%

ExplainerStatistical Bias
The Mathematics of Attenuation Bias: How Noisy Predictors Flatten Regression Slopes
Epidemiological Methodology 35%Econometric Theory 35%Statistical Inference 30%

ExplainerModel Selection
Why BIC Identifies the True Model While AIC Optimizes for Prediction
Theoretical Statisticians 40%Predictive Modelers 40%Pragmatic Practitioners 20%

ExplainerCausal Inference
How SUTVA Prevents Network Interference from Ruining Causal Inference in the Potential Outcomes Framework
Classical Statisticians 40%Tech Industry Data Scientists 35%Causal Inference Theorists 25%

ExplainerStatistical Inference
Why Heteroskedasticity Distorts Standard Errors and How Robust Standard Errors Correct the Variance Matrix
Classical Econometricians 40%Statistical Diagnosticians 35%Small-Sample Theorists 25%
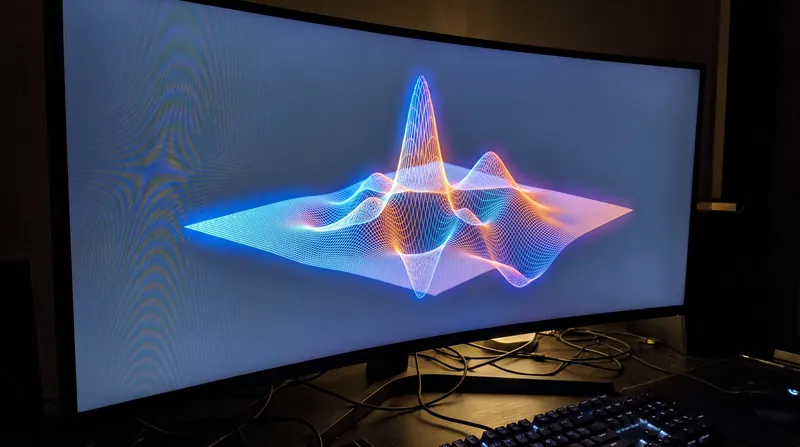
ExplainerStatistical Inference
How Maximum Likelihood Estimation Finds the Parameters That Maximize the Likelihood Function
Theoretical Statisticians 40%Applied Data Scientists 40%Quantitative Analysts 20%
ExplainerRegression Analysis
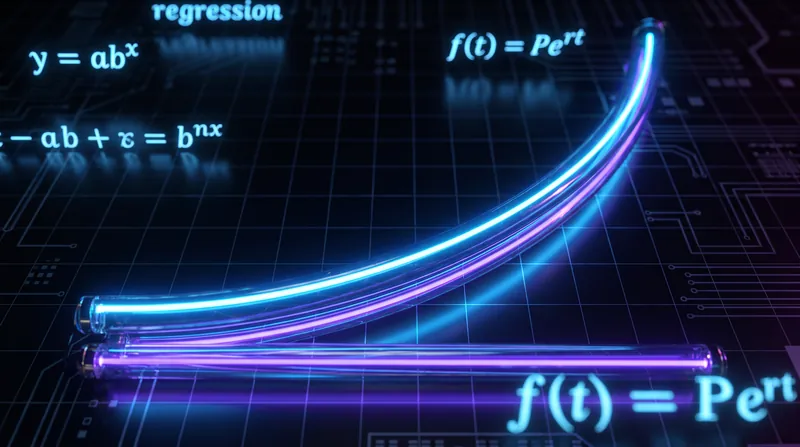
Translating Log-Log Regression Coefficients into Price Elasticity and Percentage Growth
Econometricians 40%Data Scientists 35%Epidemiologists 25%

ExplainerSpatial Statistics
How Moran's I Quantifies Spatial Clustering and Invalidates Standard Regression Assumptions on Geographic Data
Spatial Econometricians 45%GIS Analysts 40%Classical Statisticians 15%
ExplainerPolling Math
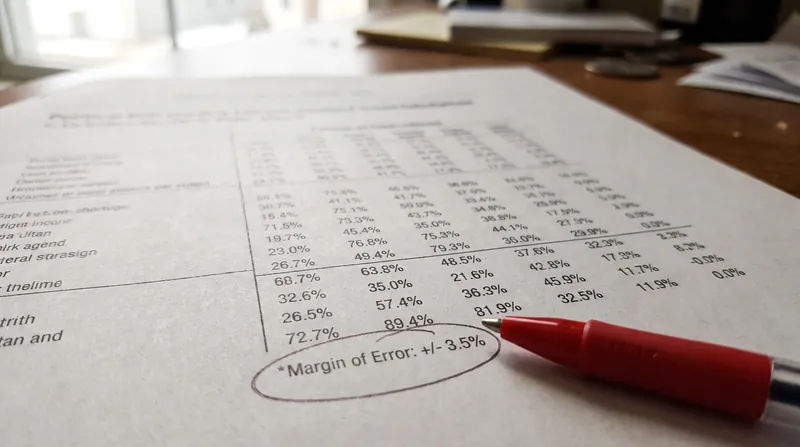
The Square Root of the Sum of Squares: Why Comparing Two Polls Requires a Larger Margin of Error
Statistical Methodologists 40%Data Journalists 35%Corporate Researchers 25%

ExplainerInformation Theory
How Kullback-Leibler Divergence Measures the Information Loss When Approximating One Probability Distribution with Another
Forward KL Advocates 40%Reverse KL Advocates 35%Symmetric Metric Proponents 25%
ExplainerImbalanced Data
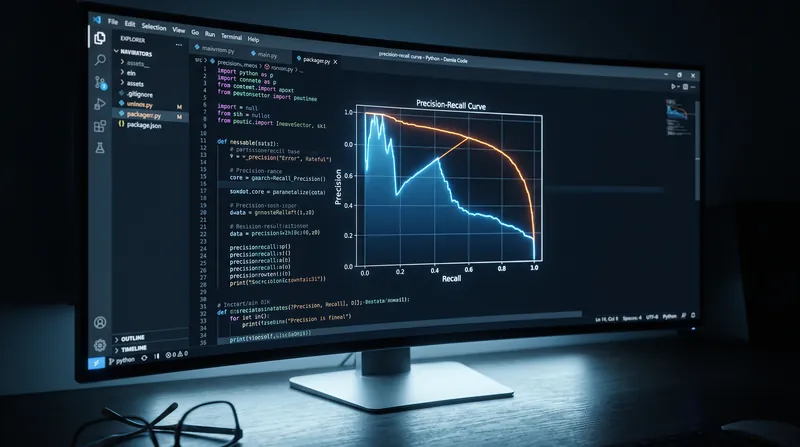
Why the Precision-Recall Curve Exposes Imbalanced Data Failures That ROC AUC Hides
Imbalanced Data Specialists 50%Traditional Statisticians 30%Business Stakeholders 20%

ExplainerCausal Inference
The d-Separation Rule: How Directed Acyclic Graphs Identify and Block All Sources of Causal Bias
Clinical Epidemiologists 35%Machine Learning Theorists 35%Applied Statisticians 30%

ExplainerStatistical Modeling
Variance Inflation Factor: Measuring Multicollinearity and Inflated Standard Errors
Applied Researchers 40%Methodologists 35%Latent Variable Analysts 25%

ExplainerTime Series Analysis
Unit Root Tests: Detecting Non-Stationarity to Prevent Spurious Regressions
Classical Econometricians 60%Time-Series Forecasters 40%

ExplainerChart Geometry
The Geometry of Deception: Why Bar Charts Require a Zero Baseline While Line Charts Do Not
Pragmatic Visualizers 50%Strict Zero Advocates 30%Scientific Communicators 20%
ExplainerEvaluation Metrics
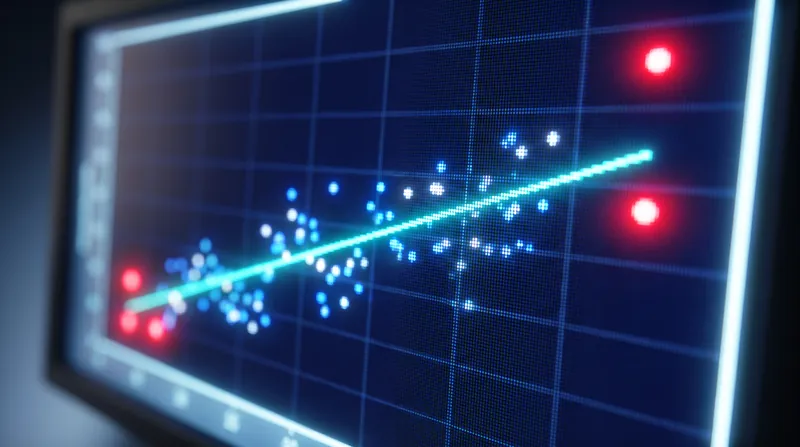
RMSE Squares Forecast Errors to Penalize Outliers More Severely Than Linear MAE
Robust Statistics Advocates 50%Risk-Averse Forecasters 50%
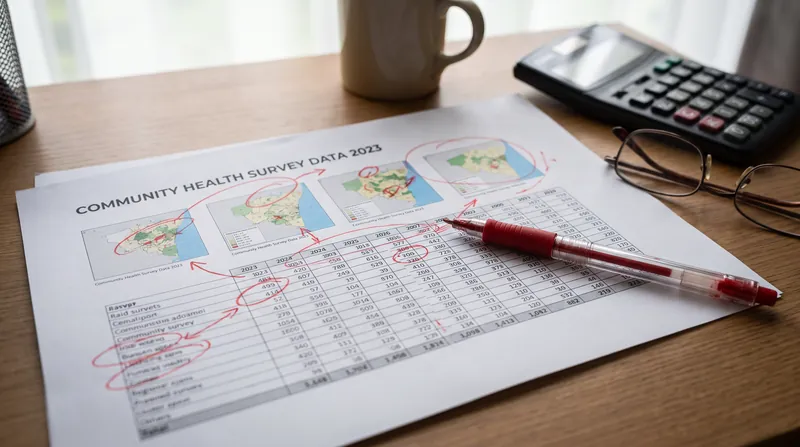
ExplainerSurvey Methodology
Why Complex Survey Designs Lose Statistical Power: Inside the Design Effect Penalty
Survey Methodologists 40%Field Researchers 40%Data Consumers 20%

Deep DiveSearch Algorithms
BM25 vs. Dense Retrieval: The Accuracy and Latency Trade-offs in Search Ranking
Hybrid Systems Engineers 40%Lexical Traditionalists 30%Neural Retrieval Advocates 30%

ExplainerCausal Inference
The Three Criteria a Variable Must Meet to Be a Confounder in Causal Inference
Classical Epidemiologists 35%Causal Inference Statisticians 35%Clinical Researchers 30%
Per page