
GuideEnergy MarketsRevision 1Updated
Energy Markets: The Complete Guide
From the uniform clearing prices of wholesale electricity to the structural divergence in global gas contracts, energy markets operate on strict mathematical rules. This guide breaks down the physical constraints and financial mechanisms that dictate how power is dispatched, oil is refined, and infrastructure is funded.

Share this story
In short
- Wholesale electricity markets use a uniform clearing price, paying all dispatched generators the highest accepted bid to incentivize efficiency.
- Locational Marginal Pricing accounts for the physical limits of the grid, spiking prices where transmission lines become congested.
- Zero-marginal-cost renewables frequently submit negative bids to secure subsidies, suppressing wholesale prices and cannibalizing their own revenue.
Global energy markets operate at the intersection of physical physics and financial mathematics. Whether trading electrons across a high-voltage grid or routing liquefied natural gas across oceans, the systems rely on strict pricing mechanisms to balance supply and demand.[14]
Unlike traditional commodities, energy products face severe logistical constraints. Electricity must be consumed the exact millisecond it is generated, while crude oil requires billions of dollars in specialized infrastructure to become usable fuel.[14]
To manage these physical realities, grid operators and commodity traders have developed complex frameworks to price energy accurately. These mechanisms dictate which power plants run, where oil barrels are shipped, and how billions of dollars in infrastructure investments are funded.[14]
Understanding these markets requires looking past headline prices to the underlying spreads, curves, and clearing rules. From the uniform clearing prices of wholesale electricity to the structural divergence in global gas contracts, the architecture of energy markets dictates the modern economy.[14]
Wholesale Electricity and the Uniform Clearing Price
Wholesale electricity markets use a competitive auction system to determine which power plants generate electricity. Grid operators rank incoming bids from generators, starting with the lowest-cost sources and moving up until they secure enough power to meet consumer demand.[3][4]
This ranking process is known as merit order dispatch. Wind, solar, and nuclear plants typically bid at or near zero, ensuring they are dispatched first. Natural gas and coal plants submit higher bids based on their fuel costs and operational efficiency.[3][4]
Once the grid operator selects enough generation to satisfy demand, the bid of the final, most expensive unit selected sets the price for the entire market. This mechanism is called the uniform clearing price, and it applies to every dispatched generator regardless of their original bid.[3][4]
Paying all generators the highest accepted bid might seem counterintuitive, but economists broadly agree it drives market efficiency. The uniform clearing price incentivizes generators to bid their true marginal costs, preventing them from artificially inflating offers to guess the final market price.[3][4]
As the Independent System Operator of New England explains in its market design documentation, "Most commodity markets operate with a UCP structure. Corn, soybeans, oil, iron ore, silver, and gold are all traded with a UCP because, like electricity, one unit of a product is like another, regardless of how it is produced."[3]
This structure also rewards low-cost and highly efficient generators. Because a wind farm or an efficient gas plant receives the same clearing price as the most expensive marginal unit, they earn a larger profit margin, which encourages ongoing investment in cheaper, cleaner technology.[3][4]
Locational Marginal Pricing and Grid Congestion
While the uniform clearing price establishes a baseline, electricity cannot always flow freely across the grid. Transmission lines have strict thermal limits, and pushing too much power through a bottleneck requires operators to dispatch different, often more expensive, generators locally.[8][9]
To account for these physical constraints, independent system operators use Locational Marginal Pricing. This system calculates the exact cost of delivering the next megawatt of power to thousands of specific nodes across the grid, updating the price every five minutes.[8][9]
A locational marginal price consists of three distinct components: the system-wide energy price, the cost of transmission congestion, and the cost of marginal losses. Losses occur naturally as electricity dissipates as heat over long distances, typically accounting for two to four percent of transacted energy.[8][9]
The congestion component drives the most extreme price variations. When transmission lines connecting cheap wind power in West Texas to high demand in Dallas reach their physical limits, the grid operator must turn on expensive local gas plants in the city.[8][9]
This localized dispatch spikes the congestion charge at the Dallas node, pushing its locational marginal price significantly higher than the underlying energy cost. For large commercial consumers and energy traders, managing the basis risk between different pricing nodes is a critical financial strategy.[8][9]
Zero-Marginal-Cost Renewables and Negative Bidding
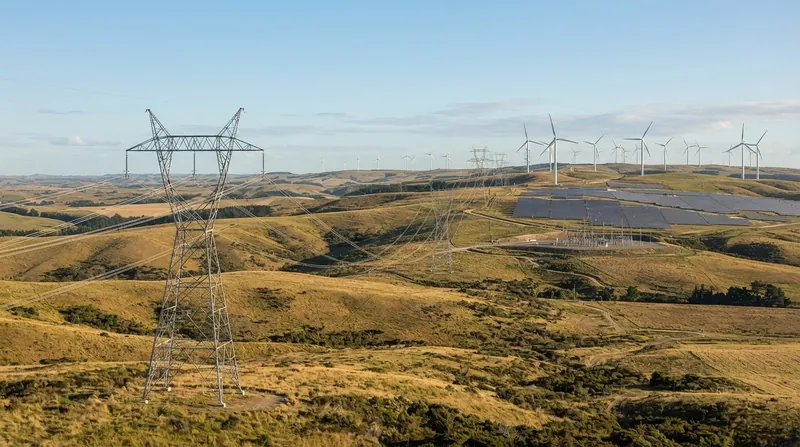
The rapid expansion of wind and solar power through 2026 has fundamentally altered wholesale market dynamics. Because these resources do not require purchased fuel to operate, their marginal cost of producing an additional megawatt is effectively zero.[5]
During periods of high wind or intense sunlight, these zero-marginal-cost resources flood the supply stack. This displaces more expensive thermal generation and frequently pushes the uniform clearing price down to zero, a phenomenon known as the merit order effect.[5]
In many markets, renewable generators actually submit negative bids, offering to pay the grid to take their power. This occurs because wind and solar projects often rely on production tax credits or renewable portfolio standard certificates that pay out only if the plant generates electricity.[5]
If a wind farm earns a twenty-dollar tax credit per megawatt-hour, it remains profitable even if it pays the grid ten dollars to accept its power. This subsidy-driven negative bidding forces inflexible coal and nuclear plants to either pay to stay online or endure costly shutdowns.[5]
However, this dynamic creates a cannibalization effect for renewable developers. As more solar capacity is added to a grid, it concentrates generation during the same midday hours, collapsing the wholesale price exactly when the solar farms are producing the most power.[5]
Spark Spreads and Power Generation Margins
For fossil-fuel power plants, profitability is not determined by the absolute price of electricity, but by the margin between power prices and fuel costs. Grid operators and traders measure this economic viability using standardized metrics known as spark and dark spreads.[1][2]
The spark spread represents the theoretical gross margin of a natural gas-fired power plant. It is calculated by subtracting the cost of the natural gas required to generate a megawatt-hour of electricity from the wholesale price of that electricity.[1]
To calculate the spread accurately, analysts use a plant's heat rate, which measures how efficiently it converts fuel into power. A highly efficient combined-cycle gas turbine typically requires a spark spread of five to ten dollars per megawatt-hour to cover variable operating costs.[1]
The dark spread applies the identical concept to coal-fired generation. When natural gas prices spike, spark spreads collapse while dark spreads widen, signaling to grid operators that coal plants have temporarily regained their economic competitiveness and should be dispatched first.[1][2]
In regions with carbon pricing, traders rely on clean spark and clean dark spreads. These advanced formulas subtract the cost of required emissions allowances from the gross margin, frequently pushing the clean dark spread into negative territory and rendering coal generation uneconomic.[1][2]
Capacity Markets and the Missing Money Problem
Wholesale energy markets are designed to pay generators for the electricity they actually produce. However, power grids require a massive surplus of standby capacity to ensure reliability during extreme weather events or sudden demand spikes.[6][7]
In a pure energy-only market, these standby plants sit idle for most of the year, relying on brief periods of extreme scarcity and massive price spikes to earn their annual revenue. Regulators, however, frequently impose price caps to protect consumers from astronomical bills.[6][7]
These price caps prevent standby generators from recovering their fixed capital and maintenance costs, a structural flaw economists call the missing money problem. Without sufficient revenue, existing plants retire prematurely, and investors refuse to finance new construction.[6][7]
To solve this, many grid operators run parallel capacity markets. These forward auctions pay power plants billions of dollars annually simply for the promise to be available and ready to generate electricity three years in the future, regardless of whether they are ever dispatched.[6][7]
Capacity market prices are anchored by two administrative formulas. The Cost of New Entry estimates the exact annual revenue a hypothetical new power plant needs to recover its construction costs, setting a benchmark for the market's price ceiling.[6][7]
The second metric is the Value of Lost Load, which quantifies the maximum price consumers are theoretically willing to pay to avoid a blackout. Together, these administrative figures dictate the reliability standard and drive billions of dollars in grid investments.[6][7]
The second metric is the Value of Lost Load, which quantifies the maximum price consumers are theoretically willing to pay to avoid a blackout.
Crude Oil Quality and Refining Economics
In global petroleum markets, all barrels of oil are not created equal. A crude oil's value is dictated by its physical properties, primarily its density, measured by API gravity, and its sulfur content, which determines whether it is classified as sweet or sour.[10][11]
Light sweet crude, such as Brent or West Texas Intermediate, commands a significant market premium. It contains less than half a percent of sulfur and can be easily boiled down into high-value gasoline and diesel using relatively simple refinery equipment.[10][11]
Heavy sour crude is dense, viscous, and laden with sulfur. Processing it requires massive capital investments, including hydro-desulfurization units that cost hundreds of millions of dollars to build and consume expensive hydrogen to strip the sulfur from the fuel.[10][11]
The price difference between these grades is known as the sweet-sour spread. When this spread widens, complex refineries that have invested in coking and desulfurization equipment generate massive profits by buying heavily discounted sour crude and upgrading it into premium fuels.[10][11]
Traders hedge these refining margins using the crack spread, most commonly the 3-2-1 ratio. This benchmark assumes a refinery buys three barrels of crude oil to produce two barrels of gasoline and one barrel of diesel, locking in the gross processing margin.[11]
Contango, Backwardation, and Oil Storage
Commodity traders do not just look at the spot price of oil today; they analyze the forward curve, which plots the price of futures contracts over the coming months and years. The shape of this curve dictates whether physical oil is hoarded or sold.[13]
When futures prices are higher than the current spot price, the market is in contango. This upward slope is driven by the cost of carry, which encompasses the expenses required to hold physical inventory, including storage tank leases, insurance, and financing rates.[13]
In a steep contango market, traders can execute a riskless arbitrage. They buy physical crude at the cheap spot price, pump it into a storage tank, and simultaneously sell a higher-priced futures contract, locking in a profit that exceeds their storage costs.[13]
Conversely, when near-term supply is exceptionally tight, buyers will pay a premium for immediate delivery. This pushes the spot price above futures prices, inverting the curve into a state known as backwardation.[13]
Backwardation signals scarcity and drains global inventories. Because holding oil loses money relative to selling it immediately, producers and traders rush to empty their storage tanks and deliver barrels to the market, rapidly balancing the supply deficit.[13]
Global LNG Pricing and the S-Curve
The liquefied natural gas market remains structurally fractured by two competing pricing philosophies. In Asia, traditional long-term contracts are oil-indexed, tethering the price of delivered gas directly to global crude oil benchmarks like Brent or the Japan Crude Cocktail.[12]
This linkage emerged decades ago when natural gas primarily competed with fuel oil for power generation. A standard contract might price the gas at a fourteen-and-a-half percent coefficient of the oil price, plus a fixed constant to cover shipping and liquefaction costs.[12]
To protect both buyers and sellers from extreme crude volatility, these contracts often feature an S-curve mechanism. This introduces kink points, establishing price floors to guarantee the producer's investment returns and price ceilings to shield the buyer if oil skyrockets.[12]
In contrast, exports from the United States rely on hub-indexed pricing. Buyers pay the spot price of gas at the domestic Henry Hub, plus a fixed tolling fee for liquefaction. This separates the commodity price risk entirely from global oil markets.[12]
Comparison
| Crude Type | Density (API) | Sulfur Content | Refining Requirements | Typical Margin |
|---|---|---|---|---|
| Light Sweet | High (>35°) | Low (<0.5%) | Minimal processing, simple distillation | High ($25–$30/bbl) |
| Heavy Sour | Low (<25°) | High (>1.5%) | Complex cracking, deep desulfurization | Low ($5–$10/bbl) |
Jargon, explained
- Uniform Clearing Price (UCP)
- An auction mechanism where all dispatched electricity generators are paid the highest accepted bid required to meet demand.
- Locational Marginal Pricing (LMP)
- A pricing system that calculates the exact cost of power at specific grid nodes, accounting for energy, congestion, and losses.
- Spark Spread
- The theoretical gross profit margin of a natural gas power plant, calculated by subtracting fuel costs from electricity revenue.
- Cost of New Entry (CONE)
- The estimated annual revenue a hypothetical new power plant needs to recover its construction and fixed costs.
- API Gravity
- A measure of how heavy or light a petroleum liquid is compared to water, used to grade crude oil quality.
Common questions
Why do wholesale electricity prices sometimes drop below zero?
When zero-marginal-cost renewables like wind and solar flood the grid, they displace thermal plants. Because these projects often receive tax credits per megawatt-hour produced, they can bid negative prices and still remain profitable.
What is the difference between contango and backwardation?
Contango occurs when futures prices are higher than the spot price, driven by the cost of storing the commodity. Backwardation happens when the spot price is higher, signaling a near-term supply shortage that incentivizes immediate delivery.
How does the 3-2-1 crack spread work?
It is a financial benchmark used by traders to hedge refining margins. It assumes a refinery purchases three barrels of crude oil to manufacture two barrels of gasoline and one barrel of diesel.
Why do capacity markets exist alongside energy markets?
Energy-only markets often feature price caps that prevent standby power plants from recovering their fixed costs during scarcity. Capacity markets pay these plants simply to remain available, ensuring grid reliability.
Competing readings
Energy Market Regulators
Focused on maintaining grid reliability and preventing market manipulation.
Regulators and independent system operators prioritize the physical stability of the grid. They advocate for uniform clearing prices to incentivize truthful bidding and rely on capacity markets to ensure enough generation exists to prevent blackouts. Their primary concern is balancing the cost to consumers with the financial incentives required to keep essential infrastructure operational.
Power Generators & Refiners
Focused on recovering fixed capital costs and maximizing processing margins.
Asset owners view energy markets through the lens of spreads and margins. For a gas plant, the spark spread dictates whether turning on the turbines is profitable; for a refiner, the sweet-sour spread determines the value of running a desulfurization unit. They argue that without capacity payments or sufficient crack spreads, the massive capital required to maintain energy infrastructure cannot be justified.
Commodity Traders
Focused on exploiting price discrepancies across locations and timeframes.
Traders provide liquidity by capitalizing on market inefficiencies. They monitor locational marginal pricing to capture basis risk between congested grid nodes, and they analyze forward curves to execute storage arbitrage during contango. To this camp, volatility and physical constraints are not problems to be solved, but opportunities to generate profit by moving energy to where it is most valued.
What changed
- · Revision 1Published.
Related explainers
- The S-Curve and J-Curve That Define the Price Relationship Between Oil-Indexed and Hub-Indexed LNG Contracts
- How Zero-Marginal-Cost Renewables Suppress Wholesale Electricity Prices and Drive Negative Bidding
- The Math Behind Contango and Backwardation: How the Forward Curve Dictates Oil Storage
- Fuel Oil Desulfurization Margins Dictate the Spread Between Light and Heavy Crude Benchmarks
- Why Electricity Markets Pay Every Power Plant the Highest Accepted Bid
- Spark and Dark Spreads: How Thermal Generators Calculate Power Margins
- The Missing Money Problem: How Capacity Markets Compensate Power Plants for Standby Reliability
- The Net Cost of New Entry and Value of Lost Load That Anchor Capacity Markets
- Locational Marginal Pricing: How Power Grids Price Energy, Congestion, and Losses
- Energy Market Regulators
- Focused on maintaining grid reliability and preventing market manipulation.
- Power Generators & Refiners
- Focused on recovering fixed capital costs and maximizing processing margins.
- Commodity Traders
- Focused on exploiting price discrepancies across locations and timeframes.
- Renewable Energy Advocates
- Focused on the zero-marginal-cost advantage and the need to redesign markets for intermittent resources.
Perspectives this story doesn't cover
- Retail electricity consumers
- Industrial energy buyers
Sources
Source coverage
14 outlets
4 viewpoints surfaced













- [1]Ryan O'Connell FinancePower Generators & Refiners
What Is a Spark Spread?
Read on Ryan O'Connell Finance → - [2]U.S. Energy Information Administration
Higher average daily wholesale electricity prices improve competitiveness of coal and gas
Read on U.S. Energy Information Administration → - [3]ISO New EnglandEnergy Market Regulators
Background on the wholesale electricity market's UCP auction
Read on ISO New England → - [4]New England Power Generators AssociationPower Generators & Refiners
The Uniform Clearing Price – The Best Market Choice
Read on New England Power Generators Association → - [5]Lawrence Berkeley National LaboratoryRenewable Energy Advocates
Impacts of Variable Renewable Energy on Wholesale Power Markets
Read on Lawrence Berkeley National Laboratory → - [6]Elia GroupEnergy Market Regulators
Adequacy & Flexibility Study 2026-2036: Appendices on the Methodology
Read on Elia Group → - [7]Emissions-EUETS
Cost of New Entry (CONE)
Read on Emissions-EUETS → - [8]UPG EnergyCommodity Traders
Locational marginal pricing (LMP) explained
Read on UPG Energy → - [9]PCI Energy SolutionsCommodity Traders
Locational Marginal Pricing (LMP) is a cornerstone of energy markets
Read on PCI Energy Solutions → - [10]PomegraCommodity Traders
Sweet–Sour Crude Spread
Read on Pomegra → - [11]Ryan O'Connell FinancePower Generators & Refiners
What Is a Crack Spread?
Read on Ryan O'Connell Finance → - [12]Government of Israel
Hub-based LNG contracts
Read on Government of Israel → - [13]CMC MarketsCommodity Traders
Contango vs backwardation
Read on CMC Markets → - [14]Factlen Editorial Team
Synthesis by Factlen editorial team
Read on Factlen Editorial Team →
More in Energy
See all →Energy Modeling
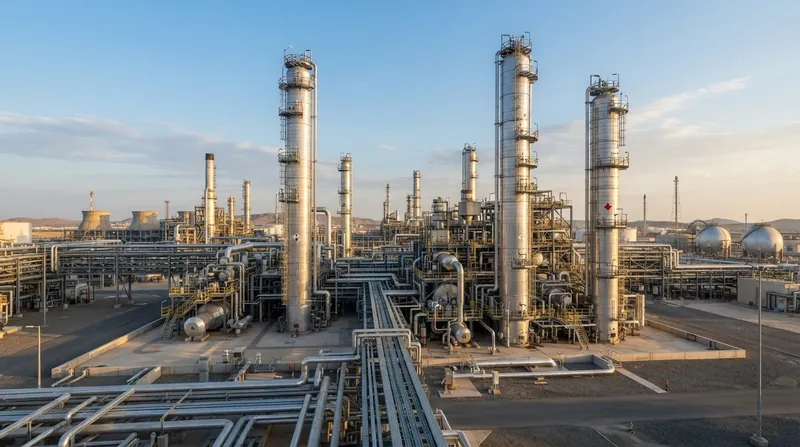
EIA Models 2050 Energy Grid: Data Centers Drive Demand While Total Consumption Stalls
2 sources

Oil Demand
OPEC Cuts 2026 Global Oil Demand Growth Forecast to 400,000 Barrels per Day
7 sources

Market Design
Why Electricity Markets Pay Every Power Plant the Highest Accepted Bid
10 sources
Global Fuel Markets
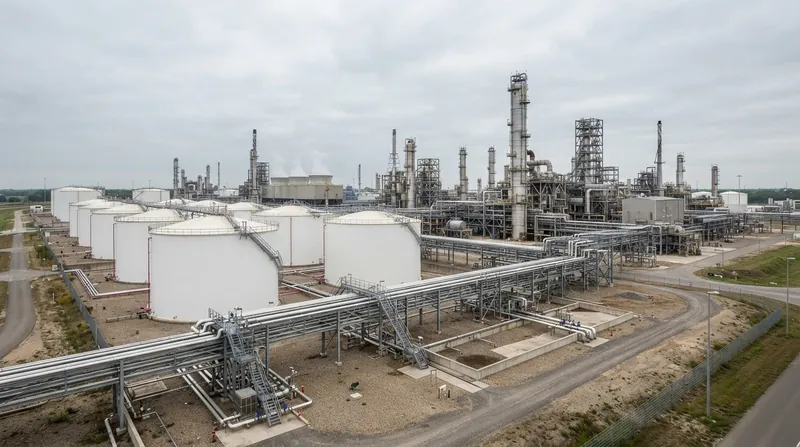
China Suspends October Fuel Exports to Rebuild Domestic Stockpiles, Tightening Global Diesel Market
6 sources
Comments
Every angle. Every day.
Get Energy stories with full source coverage and perspective breakdowns, free every day.