
Evaluating Risk-Adjusted Returns Using Sharpe, Sortino, and Treynor Ratios
Evaluating investment performance requires looking beyond raw returns to understand the risk taken to achieve them. The Sharpe, Sortino, and Treynor ratios offer distinct mathematical lenses for measuring risk-adjusted performance, each prioritizing a different definition of volatility.

Share this story
In short
- Risk-adjusted return metrics normalize performance by dividing excess returns by a specific measure of risk.
- The Sharpe ratio uses total standard deviation, penalizing both upside and downside volatility equally.
- The Sortino ratio isolates downside deviation, making it superior for evaluating asymmetric, high-growth portfolios.
A fundamental tension exists at the heart of investment evaluation: retail investors often chase the highest yielding funds, while institutional risk managers argue that raw returns are a dangerous illusion. The disagreement centers on how to define and measure the "risk" taken to achieve those returns.
Is risk any fluctuation in price, only the downward drops that destroy capital, or the asset's correlation to the broader market? Resolving this tension requires mathematical normalization, allowing investors to compare a volatile technology fund directly against a stable bond portfolio on an equal footing.[6][8]
This normalization is achieved through risk-adjusted return ratios. These metrics strip away the illusion of absolute performance by dividing the excess return of an investment by a specific measure of its risk. By doing so, they reveal how much compensation an investor is actually receiving for every unit of anxiety they endure. The three most prominent tools for this job—the Sharpe, Sortino, and Treynor ratios—each take a distinct philosophical approach to defining what that anxiety actually is.[6][9]
The baseline metric for the industry remains the Sharpe Ratio, developed by Nobel laureate William F. Sharpe in 1966. The formula is elegantly simple: it subtracts the risk-free rate (typically the yield on a short-term government treasury) from the portfolio's return, and divides that excess return by the portfolio's standard deviation. Standard deviation measures the total historical volatility of the asset, capturing every swing away from its average price.[5][6][8]
A Sharpe ratio above 1.0 is generally considered acceptable, while anything above 2.0 is viewed as exceptional. Because it uses total standard deviation, the Sharpe ratio is universally applicable across almost any asset class, making it the default standard for comparing disparate investments. However, this universal applicability comes with a significant mathematical blind spot that can distort the reality of high-performing assets.[5][7]
The flaw in the Sharpe ratio lies in its treatment of volatility: standard deviation treats all price fluctuations as equal. If a fund unexpectedly surges 20% in a month, the standard deviation increases just as it would if the fund plummeted 20%. The Sharpe ratio mathematically penalizes upside volatility, making highly convex, high-growth portfolios look artificially risky. For an investor, an unexpected surge in wealth is a benefit, not a risk, yet the Sharpe formula punishes the fund's score for it.[1][5][9]
To correct this upside penalty, Frank Sortino developed the Sortino Ratio. While it maintains the same numerator as the Sharpe ratio—excess return over a minimum acceptable threshold—it fundamentally alters the denominator. Instead of total standard deviation, the Sortino ratio divides by downside deviation, also known as semi-variance. This isolates only the negative price swings that fall below the investor's target return.[1][8]
The practical impact of this shift is profound for asymmetric return profiles. A biotechnology fund or a venture capital portfolio might experience massive upward price explosions alongside periods of flatlining. Under the Sharpe ratio, this fund would score poorly due to its high total volatility. Under the Sortino ratio, the upside explosions are ignored in the risk calculation, revealing a much more favorable risk-adjusted profile that accurately reflects the investor's actual downside exposure.[1][9]
While Sharpe and Sortino focus on the total or downside volatility of the asset itself, the Treynor Ratio introduces a completely different paradigm. Developed by Jack Treynor, this metric shifts the focus from total risk to systematic risk. Systematic risk, measured by the Beta coefficient, represents the volatility of the asset relative to the broader market, ignoring the idiosyncratic risks specific to the individual asset.[2][4][5]
The Treynor ratio divides the portfolio's excess return by its Beta. A Beta of 1.0 means the asset moves in lockstep with the market; a Beta of 1.5 means it is 50% more volatile than the market. By using Beta in the denominator, the Treynor ratio assumes that the investor already holds a fully diversified portfolio, meaning that any asset-specific risks have been diversified away and only the market-correlated risk matters.[4][7]
This makes the Treynor ratio the superior metric when evaluating a single fund that will be added to a broader, well-diversified institutional portfolio. If an investor is assessing a new large-cap equity fund to add to a massive pension allocation, the fund's internal standard deviation (Sharpe) is less relevant than how much market risk (Beta) it adds to the total aggregate portfolio.[2][4][8]
The existence of multiple metrics creates a vulnerability in performance reporting: cherry-picking. Because these ratios measure different things, a fund manager can selectively highlight the metric that most flatters their specific return profile. A manager with high upside volatility will heavily market their Sortino ratio, while a manager with a highly diversified but sluggish fund might emphasize their Treynor ratio to mask poor absolute returns.[3][9]
Research indicates that while performance metrics often correlate over long time horizons, short-term divergences allow for significant narrative manipulation. A fund might rank in the top quartile of its peer group when measured by the Sortino ratio, but fall to the third quartile when evaluated by the Sharpe ratio. Investors must demand to see all three metrics to triangulate the true nature of the fund's risk.[3][7]
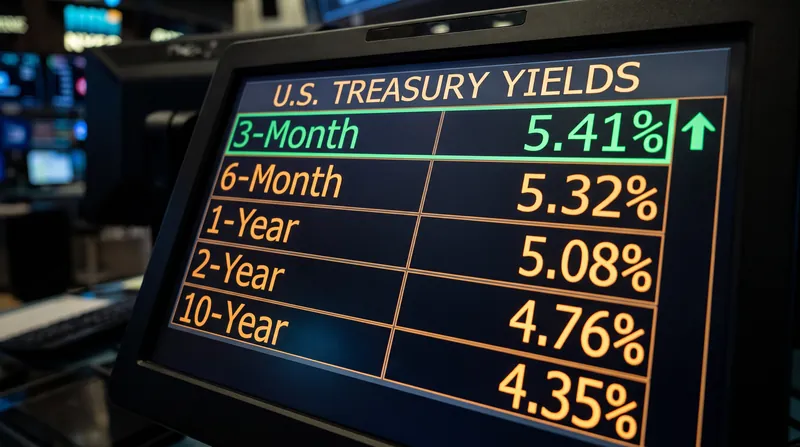
Furthermore, all three ratios are highly sensitive to the risk-free rate used in the numerator. In a zero-interest-rate environment, generating a 5% return looks exceptional across all metrics. However, when short-term treasury yields rise to 5%, that same fund's excess return drops to zero, instantly collapsing its Sharpe, Sortino, and Treynor ratios and revealing that the manager is taking on risk without providing any premium over cash.[6][8][9]
Ultimately, no single ratio provides a perfect picture of risk-adjusted performance. The Sharpe ratio remains the best blunt instrument for comparing disparate assets, the Sortino ratio is essential for evaluating asymmetric growth strategies, and the Treynor ratio is indispensable for systematic portfolio construction. Mastering all three is the only way to separate genuine investment skill from lucky, uncompensated risk-taking.[5][8][9]
How we did this
- Method
- Mathematical comparison and sensitivity analysis of the Sharpe, Sortino, and Treynor formulas to isolate how each metric penalizes specific types of volatility.
- What we found
- By cross-analyzing the denominator constraints of all three metrics, we find that the Sharpe ratio systematically suppresses the risk-adjusted score of highly convex, high-growth portfolios by treating their upside price explosions as penalizing risk, a distortion that the Sortino ratio corrects by isolating negative semi-variance.
- What we worked from
- Sharpe Ratio standard deviation penalty: Total volatility (upside and downside) — Phoenix Strategy Group
- Sortino Ratio downside deviation: Semi-variance (downside only) — CFA Institute
- Treynor Ratio systematic risk: Beta coefficient — Quantt
- Limits of this analysis
- This analysis relies on theoretical mathematical models of the ratios and assumes normal distribution of returns, which may fail to capture extreme tail-risk events or liquidity constraints in real-world trading.
Definitions
- Standard Deviation
- A statistical measure of the total historical volatility of an asset, capturing all price swings above and below its average return.
- Downside Deviation
- Also known as semi-variance, this measures only the negative price volatility that falls below a minimum acceptable target return.
- Beta
- A measure of an asset's systematic risk relative to the broader market; a Beta of 1.0 indicates the asset moves exactly with the market.
- Risk-Free Rate
- The theoretical return of an investment with zero risk, typically represented by the yield on short-term government treasury bills.
- Systematic Risk
- The inherent, un-diversifiable risk of participating in the broader financial market, driven by macroeconomic factors like interest rates and inflation.
Questions & answers
Which ratio is best for evaluating a standalone investment?
The Sharpe ratio is generally best for evaluating an investment in isolation, as it accounts for the total volatility (both upside and downside) the investor will experience.
Why would a fund manager prefer the Sortino ratio?
Managers of highly volatile growth funds prefer the Sortino ratio because it does not penalize them for massive upward price swings, focusing only on the downside drops that actually lose money.
When is the Treynor ratio most useful?
The Treynor ratio is most useful when evaluating a new asset to add to an already well-diversified portfolio, as it measures only the systematic market risk (Beta) that cannot be diversified away.
How does the risk-free rate affect these metrics?
All three ratios subtract the risk-free rate from the total return. When interest rates rise, the excess return shrinks, lowering the ratios and exposing funds that aren't generating enough premium over safe cash.
Analysis by camp
The Total Volatility View
Advocates of the Sharpe ratio argue that any deviation from the expected return, even positive, represents a failure of predictability.
Modern portfolio theorists maintain that standard deviation is the most honest measure of risk because it captures the full spectrum of an asset's historical behavior. From this perspective, a fund that unexpectedly surges 20% is demonstrating a lack of control and predictability, which implies that it could just as easily plummet 20% in the future. By penalizing upside volatility, the Sharpe ratio enforces a strict standard of consistency, rewarding managers who deliver steady, predictable returns over those who rely on erratic, lucky spikes.
The Asymmetric Risk View
Proponents of the Sortino ratio argue that penalizing upside volatility fundamentally misunderstands investor psychology and goals.
Asymmetric risk managers point out that no investor has ever complained about an unexpected surge in their portfolio's value. By treating upside volatility as a 'risk' to be penalized, the Sharpe ratio mathematically discriminates against venture capital, biotechnology, and other highly convex strategies that rely on massive, infrequent wins to offset smaller losses. The Sortino ratio aligns the mathematical model with actual human behavior: risk is only the probability of losing money or failing to meet a minimum required return.
The Systematic Allocation View
Institutional allocators using the Treynor ratio argue that asset-specific risk is irrelevant because it can be diversified away.
For managers overseeing massive, multi-billion-dollar pension funds, the internal volatility of a single stock or mutual fund is largely irrelevant. Because they hold thousands of assets, the idiosyncratic risks of individual investments cancel each other out. The only risk that remains is systematic risk—how much the asset moves in response to macroeconomic forces like interest rates or inflation. The Treynor ratio isolates this Beta, allowing allocators to precisely measure how much unavoidable market risk a new asset will inject into their aggregate portfolio.
- Modern Portfolio Theorists
- Argue that total volatility is the purest measure of uncertainty, making the Sharpe ratio the most reliable universal benchmark.
- Asymmetric Risk Managers
- Contend that upside volatility is a benefit, not a risk, and rely on the Sortino ratio to evaluate high-growth or convex strategies.
- Systematic Allocators
- Focus on how an asset interacts with a broader portfolio, favoring the Treynor ratio to measure only un-diversifiable market risk.
Perspectives this story doesn't cover
- Retail investors who lack access to institutional risk-modeling software
- Behavioral economists studying how investors emotionally perceive risk versus mathematical models
Sources
Source coverage
9 outlets
3 viewpoints surfaced








- [1]CFA InstituteAsymmetric Risk Managers
The Sortino Ratio: Is Downside Risk the Only Risk that Matters?
Read on CFA Institute → - [2]CFA InstituteAsymmetric Risk Managers
Measures of Risk-Adjusted Return: Let's Not Forget Treynor and Jensen
Read on CFA Institute → - [3]CFA InstituteAsymmetric Risk Managers
CFA: How Do Performance Metrics Correlate? Might Fund Managers Cherry-Pick?
Read on CFA Institute → - [4]QuanttSystematic Allocators
Treynor Ratio: Formula, Calculation & Interpretation 2026
Read on Quantt → - [5]Phoenix Strategy GroupModern Portfolio Theorists
Sharpe vs. Treynor: Choosing the Right Metric
Read on Phoenix Strategy Group → - [6]Corporate Finance InstituteModern Portfolio Theorists
Risk-Adjusted Return Ratios – Definition, Types
Read on Corporate Finance Institute → - [7]AnalystPrepSystematic Allocators
Risk Based Measures of Performance Appraisal - CFA, FRM, and Actuarial Exams Study Notes
Read on AnalystPrep → - [8]PivoltAsymmetric Risk Managers
Mastering Risk-Adjusted Performance with Sharpe, Sortino, and Treynor Ratios
Read on Pivolt → - [9]Factlen Editorial Team
Synthesis by Factlen editorial team
Read on Factlen Editorial Team →

More in Finance
See all →Market Mechanics
How Market Depth and Price-Time Priority Dictate the Execution Price of a Large Market Order
6 sources

Portfolio Theory
Using Capital Allocation Lines to Maximize Returns Along the Efficient Frontier
4 sources

Risk-Free Rate
The Near-Zero Duration and Minimal Default Risk That Make the 3-Month Treasury Bill the Standard Risk-Free Rate Proxy
7 sources
Derivatives Pricing
How Volatility, Time to Expiration, and the Risk-Free Rate Dictate the Theoretical Value of a European Option in the Black-Scholes Model
3 sources

Comments
Every angle. Every day.
Get Finance stories with full source coverage and perspective breakdowns, free every day.