
full timeline
US housing market slump
Sales of previously owned homes in the United States dropped 5.5% in October 2026 to their lowest annualized pace since 2010.
Follow US housing market slump in the Factlen app and get an alert when there is news. Get the app
Share this story
Latest report
US Existing Home Sales Plunge to 16-Year Low as Mortgage Rates Crush Demand
Sales of previously owned homes in the United States dropped 5.5% in October 2026 to their lowest annualized pace since 2010. The slump reflects a market paralyzed by mortgage rates hovering above 7% and persistently high property prices that have locked out buyers.
- U.S. existing home sales dropped 5.5% in October 2026 to an annualized rate of 3.75 million, the lowest level since August 2010.
- The median existing-home sales price increased 0.4% year-over-year to $416,700, marking the 40th consecutive month of annual price gains.
- First-time buyers accounted for just 29% of transactions, as 30-year mortgage rates hovering near 7.18% severely eroded purchasing power.
- Unsold housing inventory increased slightly to a 5.1-month supply, though distressed property sales remain historically low at just 2% of transactions.
Sales of previously owned homes in the United States plummeted in October 2026, dropping 5.5% from the prior month to a seasonally adjusted annual rate of 3.75 million units. This marks an 8.8% decline compared to October 2025, pushing the market to its lowest transaction volume since August 2010.[1][2][5][6]
The sharp contraction reflects a housing sector effectively paralyzed by the dual pressures of elevated borrowing costs and stubbornly high property values. Prospective buyers are finding themselves priced out of the market, while current homeowners refuse to relinquish the low mortgage rates they secured during the pandemic.[3][4][7]
"Home buying is difficult when mortgage rates have climbed to their highest levels since 2000, aside from a single month in 2023," said Lawrence Yun, chief economist for the National Association of Realtors. "As a result, home sales fell to their lowest level since August 2010."[2]
The 30-year fixed mortgage rate, the most common financing vehicle for American homebuyers, is currently hovering around 7.18%. This represents a stark contrast to the sub-3% rates seen just a few years ago, fundamentally altering the affordability calculus for millions of households.[1][8]
Inventory Creeps Upward
Despite the severe slowdown in transaction volume, the supply of available homes is beginning to inch upward as properties sit on the market for longer periods. Total housing inventory reached 1.59 million units at the end of October, representing a 1.3% increase from September.[2][3]
That figure translates to a 5.1-month supply of unsold inventory at the current sales pace, up from 4.7 months in September and 4.4 months a year earlier. While this represents the highest level of supply seen in roughly 11 years, it remains below the six-month threshold traditionally considered a balanced market.[2]
The growing inventory has not translated into price relief for frustrated buyers. The median existing-home sales price across all housing types actually increased 0.4% year-over-year to $416,700, marking the 40th consecutive month of annual price gains.[2][3]
The combination of rising prices and high interest rates has severely eroded purchasing power. The National Association of Realtors reported that its Housing Affordability Index registered at 100.7 in October, down significantly from 107.3 during the same period last year.[2]
The First-Time Buyer Squeeze
The current market dynamics have proven particularly punishing for first-time homebuyers, who lack the equity from a previous property to offset high borrowing costs. First-time buyers accounted for just 29% of all transactions in October, down from 31% the previous month and 32% a year ago.[3]
Conversely, buyers with substantial capital continue to flex their purchasing power. All-cash sales represented 29% of transactions in October, an increase from 27% in September, underscoring how the market has bifurcated between those reliant on financing and those insulated from it.[3]
"A perfect—or not-so-perfect—mix of ingredients has led to the slowdown," noted Danielle Hale, chief economist at Realtor.com. She pointed to the sharp rise in mortgage rates, the distraction of the 2026 U.S. midterm elections, and the typical seasonal downshift ahead of the winter holidays.[4]
"While they won't last long-term, these challenges are likely to keep home sales near long-time lows for the next few months," Hale added. She suggested that buyers and sellers alike may remain on the sidelines until the spring of 2027.[4]
Regional Sales Diverge
The housing slump was felt across nearly the entire country, though the severity varied by region. Month-over-month sales declined sharply in the Midwest, South, and West, while transaction volumes managed to hold steady in the Northeast.[2]
In the West, which features some of the nation's most expensive real estate, sales dropped 5.8% month-over-month to an annual rate of 3.41 million. The median home price in the region stood at $421,900, representing a modest 0.4% increase from the previous year.[2]
The South, traditionally a high-volume market driven by population growth and relatively lower costs, also saw significant pullbacks. Year-over-year sales declined across all four major U.S. regions, highlighting the universal impact of the current macroeconomic environment.[2]
Single-family homes, the bedrock of the American housing market, bore the brunt of the slowdown. Sales in this category decreased 5.8% from September to a seasonally adjusted annual rate of 3.41 million, down 8.6% from October 2025.[2]
Homeowner Wealth Accumulation
While the transaction data paints a bleak picture for buyers, the underlying financial health of current property owners remains remarkably robust. Years of steady price appreciation have endowed existing homeowners with unprecedented levels of equity.[2]
"Despite fewer transactions in October, the 88 million homeowners across the country are largely in a comfortable financial position due to sizable housing wealth accumulation," Yun explained. He pushed back against comparisons to the 2008 housing crash.[2]
This financial stability is reflected in the near-total absence of forced selling. The number of distressed property sales—which include foreclosures and short sales—remains historically low, accounting for only 2% of all transactions in October.[2]
During the depths of the Great Recession, when home sales last touched these levels, distressed properties made up a massive portion of the market, driving prices downward in a deflationary spiral. Today's market, characterized by low supply and high equity, operates on entirely different fundamentals.[4]
Pent-Up Demand Builds
Industry analysts suggest that the current freeze in transaction volume is masking a growing reservoir of latent demand. The U.S. population has grown by roughly 30 million people since home sales last hit an annualized rate of 3.75 million in 2010.[4]
"Based on the current underwhelming home sales pace at a time of consistent job growth, there could be sizable pent-up demand if mortgage rates decline," Yun noted. He pointed to the underlying demographic pressures that remain unresolved.[2]
The broader macroeconomic picture continues to dictate the trajectory of mortgage rates. The U.S. Federal Reserve hiked interest rates in September for the first time since 2023, responding to inflation data that came in hotter than anticipated.[1]
While Freddie Mac's weekly survey recently showed 30-year mortgage rates falling for four consecutive weeks, economists caution that this trend may be short-lived. Persistent consumer price increases suggest the central bank may maintain a restrictive monetary posture into 2027.[1][4]
The Lock-In Effect Persists
The structural gridlock in the housing market is largely driven by what economists call the lock-in effect. Homeowners who secured 3% or 4% mortgage rates during the pandemic are mathematically disincentivized from selling, as purchasing a new home would require taking on a 7% loan.[3][4]
This dynamic has fundamentally altered the lifecycle of American homeownership. The median time a homeowner remains in their property has stretched significantly, reducing the natural churn of inventory that typically sustains a healthy real estate ecosystem.[3]
Sources
- [1]The Guardian — Home sales hit 16-year low in October amid record-high mortgage rates Read on The Guardian →
- [2]National Association of Realtors — Existing-Home Sales Decreased 5.5% in October Read on National Association of Realtors →
- [3]HousingWire — Existing home sales hit a new low as rates stay high Read on HousingWire →
- [4]Real Estate News — Existing home sales drop to levels not seen in 16 years Read on Real Estate News →
- [5]Eye on Housing — Existing Home Sales Fell to 16-Year Low Read on Eye on Housing →
- [6]American Bankers Association — ABA DataBank: Existing home sales fell in October Read on American Bankers Association →
- [7]Mortgage Professional America — Rates at a 23-year high drive buyers from the market Read on Mortgage Professional America →
- [8]BigGo Finance — US October Existing-Home Sales Plunge to 16-Year Low as Mortgage Rates Above 7% Crush Buyer Demand Read on BigGo Finance →
What to watch
- The transaction freeze is expected to drag on fourth-quarter economic growth as spending on home improvement and moving services contracts.
Charts, maps and images
Timeline
November 2026
US Existing Home Sales Plunge to 16-Year Low as Mortgage Rates Crush Demand
October 2026
US Pending Home Sales Plunge 7.3% to Record Low in September
September 2026
US Pending Home Sales Edge Up 0.3% in August as Buyers Navigate High Rates
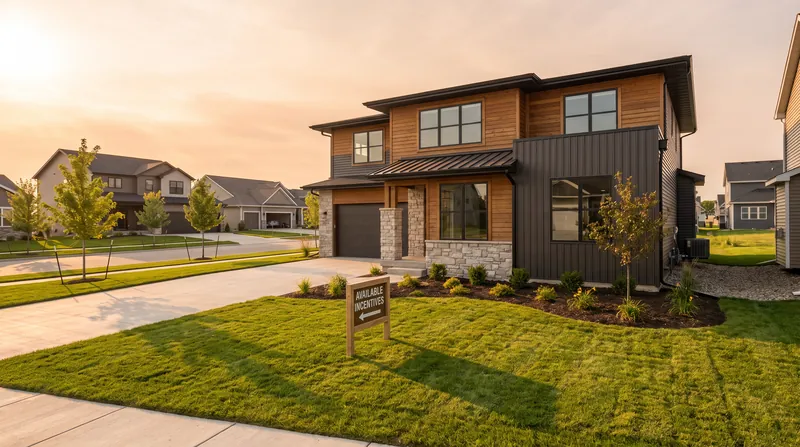
US Homebuilder Sentiment Hits 2026 Low, Prompting Increased Incentives for Buyers
Homebuyers Gain Leverage as Builders Increase Incentives to Move Inventory
How the story developed
In September, the NAHB Housing Market Index fell three points to 32, marking a 12-month low and its lowest level of the year. Elevated mortgage rates, persistent labor shortages, and high material costs weighed on construction firm margins.
To counter weak buyer traffic, 66 percent of homebuilders offered sales incentives, including mortgage rate buydowns. The share of builders cutting home prices outright rose to 38 percent in September, with the average reduction holding at 6 percent. This shift provided buyers with increased negotiating power despite the elevated rates.
On September 20, data showed that pending home sales rose 0.3 percent month-over-month in August, breaking a two-month streak of declines. The slight monthly gain reflected a brief dip in mortgage rates that pulled some sidelined buyers back into the market.
Despite the August increase, contract signings remained down 4.7 percent compared to August 2025. Inventory constraints and affordability challenges continued to cap overall transaction volume.
On October 21, the US Pending Home Sales Index plunged 7.3 percent for September, reaching its lowest level since tracking began in 2001. The sharp decline reversed the brief August stabilization, driven by 30-year fixed mortgage rates climbing back above 7 percent. Sellers continued to withhold inventory due to the lock-in effect of their existing low-rate mortgages, keeping prices elevated despite falling demand.