
The Duty Cycle Illusion: Why a GPU Reporting 100% Load Can Still Hide Idle Compute Cores
Consumer monitoring tools measure the percentage of time a graphics card is active, not how much of its silicon is actually doing math. This discrepancy means a GPU showing maximum utilization might still have significant untapped rendering capacity.

Share this story
In short
- Consumer monitoring tools measure GPU duty cycle, not computational saturation.
- A GPU can report 100% utilization while up to 40% of its compute cores sit idle.
- Memory-bound workloads frequently cause compute cores to stall while waiting for data.
A graphics card reporting 100% utilization is not necessarily running at maximum computational capacity; it is simply active during every polling interval. When Windows Task Manager or overlay software reads full load, it measures the duty cycle—the percentage of time the GPU is not entirely idle—rather than the saturation of its arithmetic logic units (ALUs). This means a GPU showing maximum utilization might still have significant untapped rendering capacity hidden behind memory stalls.[1][2]
This distinction explains why two different games can both peg a GPU at 100% while drawing vastly different amounts of power and generating different thermal loads. The metric displayed to consumers is fundamentally a measure of time, whereas true hardware saturation is a measure of computational volume. If a graphics card receives a command, begins processing it, and spends 90% of the millisecond waiting for data to arrive from its VRAM, the monitoring software still records that millisecond as active.[2]
HP's engineering documentation on system bottlenecks highlights this exact diagnostic trap for consumers trying to optimize their systems. "A PC bottleneck occurs when the components in your PC are holding each other back," the manufacturer notes, pointing out that a processor waiting on memory is technically working, but it is not computing. The hardware is bottlenecked by the speed at which data can be moved, not the speed at which it can be processed.[6]
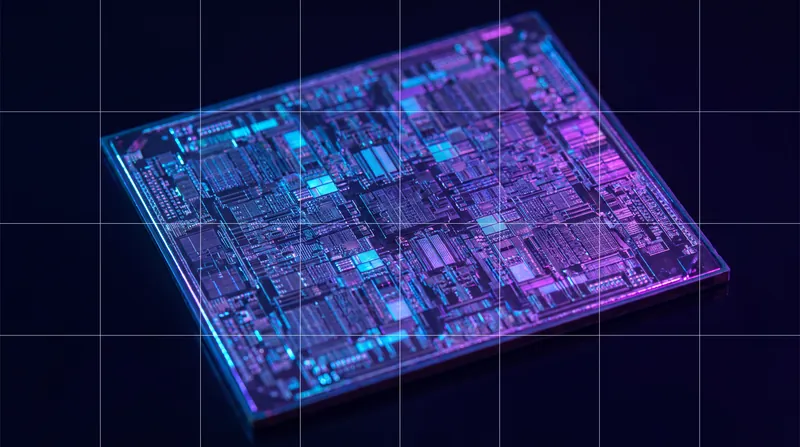
To understand the gap between reported utilization and actual saturation, one must look at the physical architecture of modern graphics silicon. A contemporary GPU contains thousands of individual streaming multiprocessors (SMs) designed to execute math in parallel. These cores rely on a constant stream of data to remain productive.[4]
If a game engine issues a workload that only requires 40% of those SMs, but issues those instructions continuously without a break, the monitoring software will report 100% utilization. The remaining 60% of the silicon sits idle, yet the user sees a fully maxed-out graph because the hardware never entered a complete sleep state during the polling window.[2]
This phenomenon is particularly evident in memory-bound workloads. A 2023 arXiv preprint analyzing machine learning inference scheduling demonstrated that during memory-heavy operations, actual compute saturation often hovers below 60% even when system-level utilization reports 100%. The cores are simply waiting for the memory bus to deliver the next batch of data.[3]
The same principle applies directly to gaming. High-resolution textures require massive memory bandwidth. When the GPU's memory bus is saturated, the compute cores stall, waiting for the next batch of texture data to arrive before they can calculate the next frame's lighting and geometry. The GPU is active, but it is not rendering.[4]
API overhead also plays a crucial role in creating this illusion. Microsoft's DirectX 12 architecture, introduced in August 2014, was specifically designed to address how draw calls—instructions from the CPU telling the GPU what to render—were bottlenecking performance. Prior to this, CPUs struggled to keep GPUs fed with enough instructions to keep them active.[5]
Before low-overhead APIs became the standard, a CPU could only feed the GPU through a single thread. If that thread maxed out, the GPU would stall, resulting in low utilization. As Microsoft noted in its 2014 developer release, "Direct3D 12 enables developers to significantly improve the CPU utilization of their games," allowing multi-threaded command generation to keep the GPU fed with instructions.[5]
However, keeping the GPU fed does not mean filling its execution ports. It simply means the GPU is never entirely asleep. A graphics card running a highly optimized compute shader that uses all its ALUs will draw significantly more wattage than the same GPU running a memory-bound game, even if both report 100% utilization to the operating system.[2][4]
Hardware manufacturers are acutely aware of this discrepancy. NVIDIA's Nsight graphics profiling tools provide developers with granular metrics like "SM Active" and "SM Issue" to distinguish between a core being turned on and a core actually executing math, a level of detail entirely absent from consumer overlays.[2]
For the consumer, the takeaway is that a 100% utilization reading is a necessary but insufficient condition for maximum performance. It confirms the CPU is not holding the graphics card back, but it does not guarantee the graphics card is operating at its theoretical compute limit. True saturation is measured in wattage and framerates, not duty cycles.[1][6]
Key terms
- Duty Cycle
- The percentage of time a component is active or powered on during a given measurement period, regardless of how much work it is doing.
- Streaming Multiprocessor (SM)
- The individual clusters of compute cores inside a GPU that execute mathematical operations in parallel.
- Draw Call
- An instruction sent from the CPU to the GPU telling it what geometry or textures to render next.
- Memory Bandwidth
- The maximum rate at which data can be read from or stored into a semiconductor memory by a processor.
Frequently asked
Why does my GPU say 100% but my framerate is low?
Your GPU may be spending most of its time waiting for data from its memory (VRAM) rather than actually computing frames. It is active, but not productive.
Is 100% GPU utilization bad for my computer?
No. It simply means the GPU is not waiting on the CPU for instructions. It is the intended state for gaming, provided temperatures remain within safe limits.
How can I tell if my GPU is actually maxed out?
Power draw (wattage) is often a better indicator of true hardware saturation than the utilization percentage. A fully saturated GPU will draw power closer to its maximum rated limit.
Viewpoints in depth
The Hardware Engineering View
Engineers view utilization as a flawed metric that obscures true silicon efficiency.
From a hardware design perspective, a GPU is only truly utilized when its arithmetic logic units (ALUs) are executing math on every clock cycle. Engineers rely on low-level profiling tools to measure 'SM Issue' rates, which track exactly how many instructions are being processed. To them, a GPU reporting 100% utilization while waiting on memory is experiencing a bottleneck, not achieving peak performance. This is why modern architectural improvements focus heavily on increasing cache sizes to keep data closer to the compute cores, minimizing the stalls that inflate duty cycle readings.
The Game Developer View
Developers focus on keeping the GPU fed with instructions to avoid CPU bottlenecks.
For game engine programmers, seeing 100% GPU utilization is generally considered a success because it indicates the CPU is successfully delivering draw calls fast enough to keep the graphics card busy. The introduction of low-overhead APIs like DirectX 12 and Vulkan was driven by the need to multi-thread these draw calls. While developers know the GPU might still be stalling on memory fetches, ensuring the CPU is not the limiting factor is the first and most critical step in rendering optimization.
The Consumer Diagnostic View
PC builders use utilization metrics as a binary indicator of system balance.
In the consumer space, 100% GPU utilization is treated as the gold standard for a well-balanced gaming PC. If a system reports 99% or 100% GPU usage during a game, enthusiasts conclude that their processor is adequate and they are getting the maximum possible framerate out of their graphics card. While technically an oversimplification of how the hardware operates, this binary approach remains the most practical way for consumers to decide whether they need to upgrade their CPU or their GPU to improve performance.
- Hardware Engineers
- Focus on the physical saturation of streaming multiprocessors and the distinction between a core being active versus executing math.
- Game Developers
- Prioritize API overhead, draw calls, and memory bandwidth optimization to keep the GPU fed with instructions.
- PC Enthusiasts
- Rely on OS-level metrics to diagnose system bottlenecks and determine hardware upgrade paths.
Perspectives this story doesn't cover
- Overlay Software Developers
Sources
Source coverage
7 outlets
3 viewpoints surfaced







- [1]Tech GuidedPC Enthusiasts
Why Is My GPU Utilization Low While Gaming?
Read on Tech Guided → - [2]ArthurChiao's BlogHardware Engineers
Understanding NVIDIA GPU Performance: Utilization vs. Saturation
Read on ArthurChiao's Blog → - [3]arXivHardware Engineers
ML Inference Scheduling with Predictable Latency
Read on arXiv → - [4]WccftechPC Enthusiasts
CPU or GPU Bottleneck? How to Diagnose What's Really Limiting Your Gaming Performance
Read on Wccftech → - [5]Microsoft Developer BlogsGame Developers
DirectX 12 - High Performance and High Power Savings
Read on Microsoft Developer Blogs → - [6]HP® Official SitePC Enthusiasts
What is PC Bottleneck and How Do I Prevent It?
Read on HP® Official Site → - [7]Factlen Editorial Team
Synthesis by Factlen editorial team
Read on Factlen Editorial Team →
More in Technology
See all →Generative AI Adoption
Japanese Game Developers' Generative AI Adoption Rate Jumps to 86%, CESA Report Finds at TGS 2026
7 sources

Rendering Tech
The Bounding Volume Hierarchy (BVH): How Ray Tracing Calculates Light Paths Without Rasterizing a Scene
3 sources

Display Protocols
Variable Refresh Rate Protocols Stretch Blanking Intervals to Eliminate Screen Tearing
6 sources

Display Tech
Grey-to-Grey vs. Moving Picture Response Time: The Definitional Difference in Display Motion Clarity
4 sources
Comments
Every angle. Every day.
Get Technology stories with full source coverage and perspective breakdowns, free every day.