
GuideGlobal Renewable Electricity GenerationRevision 1Updated
Global Renewable Electricity Generation: The Complete Guide
Solar, wind, and hydropower now generate more than a third of the world's electricity, fundamentally reshaping global power grids. This guide examines the technologies, economics, and infrastructure driving the transition away from fossil fuels.

Share this story
In short
- Renewable energy generated 33.8 percent of global electricity in 2025, overtaking coal for the first time in history.
- Solar power met 75 percent of the net increase in global electricity demand, halting the growth of fossil fuel generation.
- Global battery storage costs plummeted by 45 percent in a single year, enabling the shift toward round-the-clock solar availability.
For the first time since the dawn of the modern power grid, renewable energy has overtaken coal as the world's primary source of electricity. In 2025, solar, wind, and hydropower generated 33.8 percent of global electricity, edging past coal's 33.0 percent share.[1]
This structural milestone represents a profound shift in global energy infrastructure. Driven by an unprecedented expansion in solar photovoltaics and plummeting battery costs, clean power met all new global electricity demand in 2025.[1][4]
The transition is accelerating faster than historical models predicted. Just twenty-five years ago, renewables accounted for less than 19 percent of global power, overwhelmingly dominated by legacy hydroelectric dams. Today, variable renewables like wind and solar are driving the expansion.[3]
Understanding this shift requires looking beyond the headline percentages. The global power grid is a complex, interconnected system where generation costs, regional policies, and physical infrastructure must align to keep the lights on.[14]
As the world attempts to triple renewable capacity by 2030, the focus has moved from simply building solar panels to integrating them into a stable, continuous power supply.[6]
The Scale of the Transition
The sheer volume of electricity now generated by renewable sources is staggering. In 2025, global renewable generation reached 10,730 terawatt-hours (TWh), an increase that effectively halted the growth of fossil fuel generation.[1]
Coal power dropped by 63 TWh in 2025, marking its first absolute decline outside of the 2020 pandemic anomaly. Combined with steady overall electricity demand growth, this pushed coal below a third of global generation for the first time in history.[1][2]
Solar power is the undisputed engine of this recent growth. Solar generation rose by 636 TWh in 2025, a 30 percent year-over-year increase, allowing it to meet 75 percent of the net increase in global electricity demand alone.[3][5]
Wind power also maintained strong momentum, with onshore and offshore installations contributing significantly to the clean energy mix. Together, wind and solar accounted for 95 percent of all renewable capacity additions globally.[8][9]
Meanwhile, legacy sources like nuclear power have seen their share of the global mix dilute. While nuclear reactors generated a record 2,702 TWh in 2025, the massive growth in overall electricity demand means nuclear's share has halved since 2000, landing at roughly 8.9 percent.[3][5]
Fossil fuels still account for a majority of global electricity generation, sitting at approximately 57 percent in 2025. However, the trajectory is clear: the era of fossil-led grid expansion has effectively ended.[3]
The Economics of Clean Power
The primary driver behind the rapid deployment of wind and solar is no longer just climate policy, but raw economics. On an unsubsidized basis, renewable energy remains the most cost-competitive form of new power generation available today.[11]
According to Lazard's Levelized Cost of Energy analysis, the gap between the cost of new wind and solar projects and the marginal cost of operating existing combined-cycle gas turbines has widened. Persistent low gas prices have not been enough to offset the capital efficiency of new renewables.[11][13]
Utility-scale solar and onshore wind consistently beat coal and nuclear on a dollar-per-megawatt-hour basis. Companies that can leverage supply chain economies of scale are driving the levelized cost of energy even lower for best-in-class renewable assets.[11]
The most significant economic development of 2025, however, was the collapse in energy storage costs. Global battery costs dropped by an astonishing 45 percent in a single year, falling to roughly $70 per kilowatt-hour.[4]
This price collapse is fundamentally changing grid economics. The 247 gigawatt-hours of battery capacity added globally in 2025 is enough to shift 14 percent of the newly added daily solar generation from daytime hours into the evening peak.[4]
This pairing of cheap solar with affordable storage is enabling what industry analysts call the shift from "daytime solar" to "anytime solar." It directly addresses the intermittency problem that has historically limited renewable penetration on legacy grids.[1][4]
Regional Leaders and Disparities
The deployment of renewable energy is highly concentrated, with a few key regions driving the vast majority of global growth. China, the United States, and Europe collectively account for 84 percent of all new renewable capacity added worldwide.[7]
China is operating on a scale that dwarfs the rest of the world. Over the 2024 to 2030 period, China is expected to install 3,207 gigawatts of new renewable electricity capacity, more than tripling its growth from the previous six years.[9]
By the end of this decade, China is projected to hold at least half of the world's cumulative renewable electricity capacity. The country surpassed its 2030 ambition of 1,200 GW of combined solar and wind capacity six years early, in mid-2024.[10]
The United States and Europe are also experiencing rapid growth, though they face distinct headwinds. In the U.S., turbine shortages, rising capital costs, and long interconnection queues have created friction for developers, even as federal tax incentives drive record investment.[11][12]
India is emerging as a critical growth market. The country's annual renewable capacity additions are expected to more than quadruple, rising from 15 GW in 2023 to 62 GW by 2030, driven by surging domestic electricity demand.[9]
In contrast, many developing nations in Africa and Southeast Asia are still heavily reliant on fossil fuels, though distributed solar and untapped hydropower present massive potential. Hydropower is expected to contribute 20 to 30 GW annually through 2030, largely in these emerging economies.[9]
Grid Integration and Infrastructure
Generating renewable electricity is only half the challenge; delivering it reliably requires massive infrastructure upgrades. As the share of variable renewable energy rises, grid operators must manage unprecedented fluctuations in power supply.[14]
By 2030, variable renewables like wind and solar are forecast to account for two-thirds of global renewable electricity generation, up from less than 45 percent today. This shift demands a more flexible and responsive transmission network.[8]
Pumped-storage hydropower remains the most established technology for long-duration energy storage. Annual additions of pumped-storage capacity are forecast to double to 16.5 GW by 2030, with China leading over 60 percent of this worldwide expansion.[8]
Europe is also accelerating its pumped-storage development, particularly in Spain and Austria, as the rapid deployment of variable renewables creates acute integration challenges during periods of low wind and high solar output.[8]
Transmission bottlenecks remain a severe limiting factor globally. In many advanced economies, it now takes longer to secure a grid connection and environmental permits for a new wind farm than it does to physically construct the turbines.[11][14]
To fully utilize the 4,600 GW of renewable capacity expected to come online between 2025 and 2030, nations must drastically streamline permitting processes and invest billions in high-voltage transmission lines to carry power from remote generation sites to urban demand centers.[8][14]
The Role of Legacy Renewables
While solar and wind dominate the headlines, legacy renewable sources like hydropower and bioenergy continue to provide critical baseload stability. Hydropower remains the largest single source of renewable electricity globally, though its growth has slowed compared to photovoltaics.[2][9]
Hydropower generation is highly dependent on regional weather patterns and precipitation. Droughts in major hydro-producing regions like China and the Pacific Northwest have occasionally forced grid operators to temporarily ramp up coal and gas generation to cover the shortfall.[14]
Bioenergy, geothermal, and concentrating solar power make up a much smaller fraction of the mix, remaining unchanged at less than 3 percent of total power generation. However, they offer valuable dispatchable power that can be turned on when the sun sets and the wind dies.[8]
Geothermal energy, in particular, is seeing renewed interest due to technological advancements in deep drilling. While capital-intensive, new-build geothermal projects offer a reliable, zero-carbon baseload alternative to nuclear and coal.[11][13]
Offshore wind is also transitioning from a niche European technology to a global baseload contributor. The annual offshore wind market is expected to expand from 9.2 GW in 2024 to over 37 GW by 2030, providing highly consistent generation profiles compared to onshore wind.[12]
The Electrification of Everything
The rapid expansion of renewable electricity is occurring alongside a massive increase in overall power demand. The global energy system is undergoing a structural shift toward electrification, replacing direct fossil fuel combustion in transport and heating.[8]
Global electricity demand increased by 4.3 percent in 2024, a significant acceleration from the historical average. This growth is driven by the widespread adoption of electric vehicles, the installation of residential heat pumps, and the energy-intensive rise of new data centers.[10]
In the United States, data centers accounted for roughly half of the country's electricity demand growth in recent years. Globally, the electricity required to power artificial intelligence and cloud computing is rivaling the demand growth from the entire electric vehicle sector.[4]
This surging demand means that renewable generation must grow at an extraordinary pace simply to keep fossil fuel use flat. In 2025, clean power successfully met all 849 TWh of new electricity demand, preventing a rise in global emissions.[1]
However, to actively displace the 57 percent of the grid still powered by coal and gas, renewable deployment must accelerate further. The spillover effect of a clean grid is immense, as it simultaneously decarbonizes the industrial and transportation sectors that plug into it.[3][8]
The Path to 2030
At the COP28 climate summit, the international community committed to tripling global renewable power capacity to 11 terawatts by 2030. Achieving this target is widely considered essential to keeping global temperature rises within the 1.5-degree Celsius threshold.[6]
Despite record-breaking additions in 2024 and 2025, current growth rates indicate the world is not on track to meet this ambitious goal. The International Renewable Energy Agency estimates that the world needs to add more than 1,120 GW of capacity each year for the rest of the decade.[6]
Current forecasts from the International Energy Agency project that global renewable capacity will increase by roughly 4,600 GW between 2025 and 2030. While this is double the deployment of the previous five years, it falls short of the COP28 trajectory.[8][12]
Closing this gap will require unprecedented policy intervention and capital deployment, particularly in developing economies. High interest rates and the cost of capital disproportionately affect renewable projects, which require massive upfront investment but have near-zero marginal operating costs.[11][14]
The next five years will test the physical and financial limits of the global supply chain. Manufacturers must produce millions of solar panels, wind turbines, and battery cells, while mining operations must scale up the extraction of critical minerals like lithium and copper.[14]
The milestone of renewables overtaking coal in 2025 proves that rapid, structural decarbonization is technologically and economically feasible. The challenge now is scaling that success across every region and every sector of the global economy.[1][14]
The role of policy cannot be overstated in this transition. In more than 130 countries, specific regulatory frameworks, tax incentives, and feed-in tariffs continue to support the deployment of wind and solar, artificially lowering the barrier to entry for new developers.[8]
In the European Union, the push for energy independence following the 2022 geopolitical energy crisis has permanently altered the regulatory landscape. Permitting times for solar installations have been slashed, leading to a boom in both utility-scale and distributed rooftop systems.[14]
In the European Union, the push for energy independence following the 2022 geopolitical energy crisis has permanently altered the regulatory landscape.
Conversely, abrupt policy shifts can stall momentum. The early phase-out of certain investment and production tax credits, alongside new restrictions on foreign entities of concern, led the IEA to revise its U.S. renewable growth forecast downward by almost 50 percent for some technologies.[8]
Ultimately, the transition to a fully renewable global grid is no longer a question of technological viability, but of execution speed. The hardware exists, the economics are favorable, and the environmental imperative is universally recognized.[14]
Comparison
| Technology | Primary Role | Global Capacity (2024) | Recent Growth Trend | Grid Integration Challenge |
|---|---|---|---|---|
| Solar PV | Variable Daytime Generation | 2.2 TW | Exponential (550 GW added in 2024) | Requires massive battery storage for evening peak |
| Wind (Onshore) | Variable Generation | 1.1 TW | Steady (120 GW added in 2024) | Requires long-distance transmission from remote sites |
| Hydropower | Dispatchable Baseload | 1.4 TW | Slow (20-30 GW annual additions) | Vulnerable to regional droughts and climate shifts |
| Geothermal | Zero-Carbon Baseload | <20 GW | Stagnant but reviving | High upfront capital and exploration risk |
| Combined-Cycle Gas | Dispatchable Peaking | 1.8 TW | Stagnating | Exposure to volatile global fuel prices |
Definitions
- Levelized Cost of Energy (LCOE)
- A metric that measures the average net present cost of electricity generation for a power plant over its assumed lifetime, allowing different technologies to be compared.
- Variable Renewable Energy (VRE)
- Energy sources like wind and solar whose output fluctuates depending on weather conditions, requiring grid flexibility to maintain stability.
- Pumped-Storage Hydropower (PSH)
- A system that stores energy by pumping water to a higher elevation when electricity is cheap, and releasing it through turbines when demand is high.
- Terawatt-hour (TWh)
- A massive unit of energy used to measure national or global electricity generation, equal to one billion kilowatt-hours.
Questions & answers
When did renewable energy finally overtake coal power?
In 2025, renewables generated 33.8 percent of global electricity, surpassing coal's 33.0 percent share for the first time in the modern era.
Why are battery storage costs so important for solar energy?
Batteries allow grid operators to store excess power generated during sunny afternoons and discharge it during the evening peak, transforming solar from a daytime-only resource into a 24/7 power supply.
Is the world on track to meet the COP28 renewable energy targets?
No. While growth is record-breaking, current forecasts project 4,600 GW of new capacity by 2030, which falls short of the 1,120 GW per year needed to triple total capacity to 11 TW.
Which country is building the most renewable energy?
China is the undisputed leader, accounting for roughly 60 percent of all global renewable capacity additions and expecting to install over 3,200 GW between 2024 and 2030.
Are fossil fuels still growing in the power sector?
Fossil fuel generation has effectively stagnated. In 2025, clean energy sources met 100 percent of the net increase in global electricity demand, causing fossil generation to drop slightly by 0.2 percent.
Analysis by camp
Clean Energy Advocates
Argue that the rapid cost declines in solar and batteries prove a 100% renewable grid is achievable and economically superior.
This perspective emphasizes that the fundamental economic barriers to a clean grid have already been broken. Advocates point to the 45 percent drop in battery costs in 2025 as the final piece of the puzzle, allowing cheap daytime solar to be shifted into the evening peak. They argue that fossil fuels are now structurally obsolete and that any remaining reliance on coal or gas is a result of political inertia rather than technological necessity. Furthermore, this camp believes that the transition will accelerate organically as economies of scale continue to drive down the levelized cost of energy. By focusing on the sheer volume of capacity being added—particularly in China—they maintain that a fully decarbonized global power sector is within reach well before mid-century, provided that governments do not artificially prop up legacy fossil assets.
Grid Operators & Utilities
Emphasize the acute physical challenges of integrating variable power, stressing the need for massive transmission upgrades and dispatchable baseload.
While acknowledging the cost-competitiveness of wind and solar, grid operators focus on the physical reality of keeping the lights on. This perspective highlights the severe transmission bottlenecks that currently plague advanced economies, noting that it often takes longer to permit a new power line than it does to build a wind farm. They argue that adding raw generation capacity is useless if the grid cannot physically transport the electrons to where they are needed. Utilities also stress the ongoing need for dispatchable baseload power—energy that can be turned on at a moment's notice. They caution that while batteries are excellent for shifting solar power by a few hours, they cannot solve multi-day weather lulls or seasonal variations. Consequently, this camp advocates for maintaining a diverse energy mix, including nuclear, geothermal, and even natural gas peaking plants, to ensure grid reliability during extreme weather events.
Energy Economists
Focus on the levelized cost of energy and capital markets, noting that high interest rates and supply chain bottlenecks are the primary risks to deployment.
Energy economists view the transition primarily through the lens of capital allocation. They note that while renewable energy has near-zero marginal operating costs, it requires massive upfront capital investment. Therefore, this perspective argues that the speed of the transition is highly sensitive to macroeconomic factors, particularly interest rates. A high-rate environment disproportionately penalizes capital-intensive wind and solar projects compared to legacy gas plants. Additionally, economists warn about the physical limits of the global supply chain. They point out that tripling renewable capacity by 2030 will require an unprecedented extraction of critical minerals like copper, lithium, and rare earth elements. If mining operations and manufacturing facilities cannot scale rapidly enough, supply chain bottlenecks could artificially inflate the cost of clean energy, stalling the transition just as it gains momentum.
What changed
- · Revision 1Published.
- Clean Energy Advocates
- Argue that the rapid cost declines in solar and batteries prove a 100% renewable grid is achievable and economically superior.
- Grid Operators & Utilities
- Emphasize the acute physical challenges of integrating variable power, stressing the need for massive transmission upgrades and dispatchable baseload.
- Energy Economists
- Focus on the levelized cost of energy and capital markets, noting that high interest rates and supply chain bottlenecks are the primary risks to deployment.
Perspectives this story doesn't cover
- Fossil fuel industry representatives arguing for the continued necessity of gas peaking plants.
- Local communities opposing the land use and visual impact of massive new transmission lines.
Sources
Source coverage
14 outlets
3 viewpoints surfaced









- [1]EmberClean Energy Advocates
Global Electricity Review 2026
Read on Ember → - [2]EmberClean Energy Advocates
Global Electricity Review 2025
Read on Ember → - [3]StatistaEnergy Economists
Renewables overtake coal as world's largest electricity source
Read on Statista → - [4]Substack
The Age of Electricity is here
Read on Substack → - [5]bne IntelliNews
Renewables' share of world electricity rises to 34% as nuclear slips to 9%
Read on bne IntelliNews → - [6]IRENAClean Energy Advocates
Renewable capacity statistics 2026
Read on IRENA → - [7]IRENAClean Energy Advocates
Renewable capacity statistics 2025
Read on IRENA → - [8]IEAGrid Operators & Utilities
Renewables 2025 - Global electricity generation report
Read on IEA → - [9]IEAGrid Operators & Utilities
Renewables 2024 - Analysis and forecast to 2030
Read on IEA → - [10]IEAGrid Operators & Utilities
Electricity - Renewables 2024
Read on IEA → - [11]LazardEnergy Economists
Levelized Cost of Energy Version 18.0
Read on Lazard → - [12]LazardEnergy Economists
Levelized Cost of Energy Version 19.0
Read on Lazard → - [13]Energy.gov
Lazard Levelized Cost of Energy Comparison
Read on Energy.gov → - [14]Factlen Editorial TeamGrid Operators & Utilities
Synthesis by Factlen editorial team
Read on Factlen Editorial Team →
More in Energy
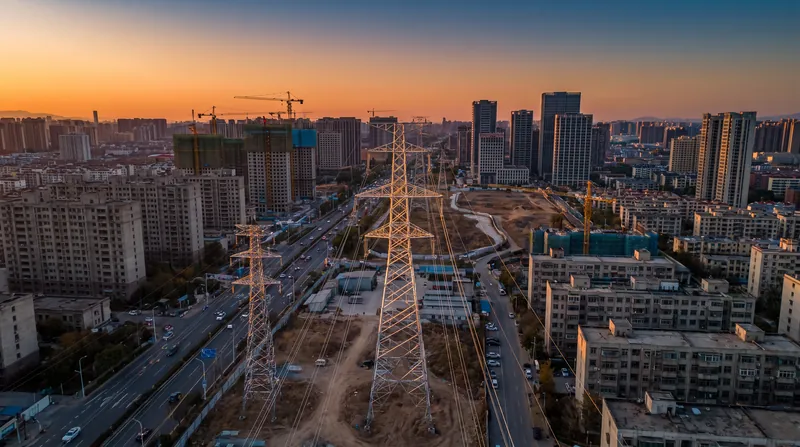
See all →Carbon Markets
Output-Based Allocation Indexes Free Allowances to Production, Averting Carbon Leakage
4 sources
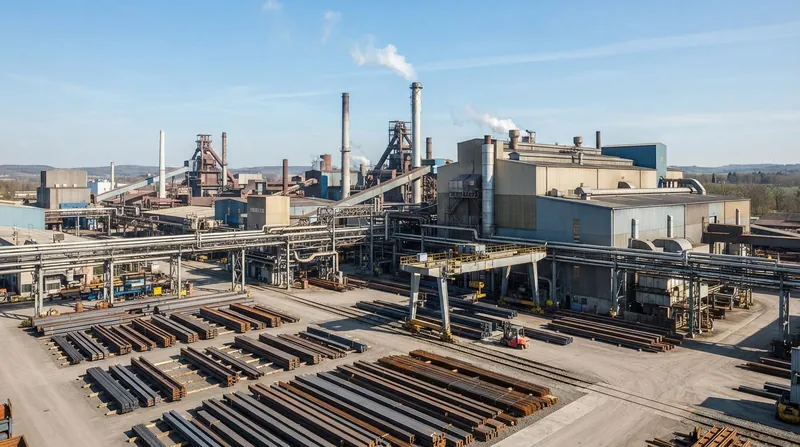
Carbon Accounting
How Annual Certificate Matching Erases Scope 2 Emissions Without Displacing Fossil Generation
2 sources
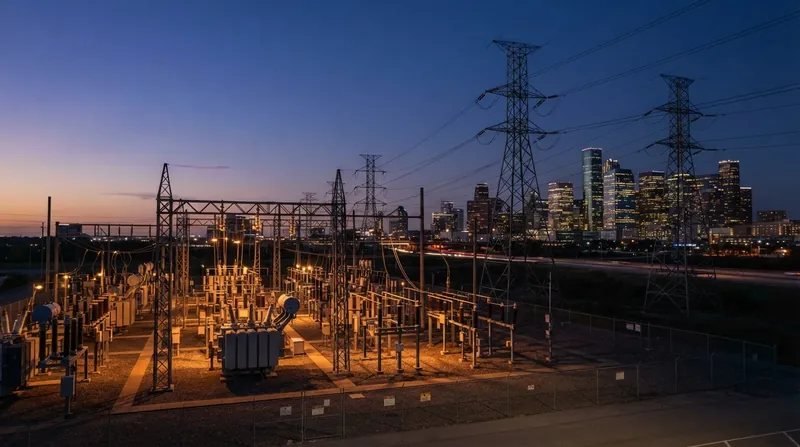
Methane Lifespan
Hydroxyl Breakdown Caps Methane Lifespans at 12 Years, Halting Additional Warming
3 sources
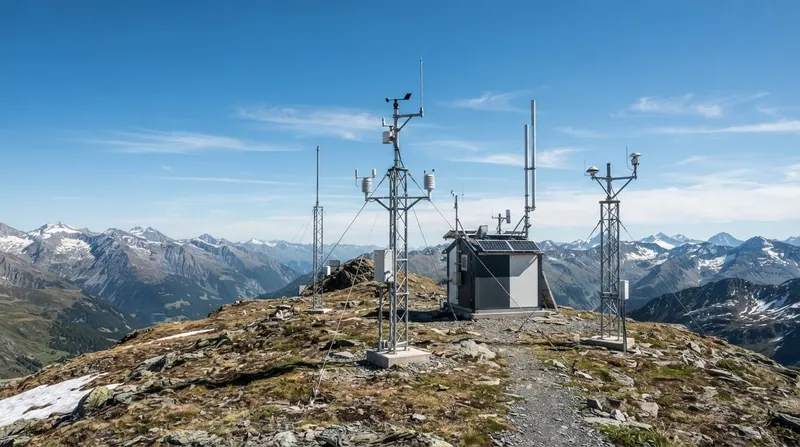
Grid Infrastructure
Replacing SF6 in High-Voltage Switchgear Forces Grids to Trade Compact Footprints for Tripled Pressures
7 sources
Comments
Every angle. Every day.
Get Energy stories with full source coverage and perspective breakdowns, free every day.